

Liquidity Engine, Part III: The $7.4 Trillion Floodgate
How a Lower-Rate World Could Unleash the Largest Cash Rotation in History
🥔 Executive Summary
Over $7.4 trillion now sits in U.S. money market funds - more than ever before. That’s not just a data point; it’s a macro powder keg. In an environment where real rates remain elevated and risk sentiment is cautious, this stockpile reflects extreme positioning.
But it won’t stay idle forever.
If the Fed pivots to a lower-rate regime - either gradually or abruptly - that wall of cash will start to move. And when it does, it won’t trickle. It will surge into assets with the highest forward return profiles. Bonds may benefit first - but this time, we believe equities may leapfrog them entirely.
This is not just a liquidity story. It’s a regime rotation, and it’s precisely what the Liquidity Engine series was built to decode.
🌍 Macro Backdrop: The Setup is Complete
Fed Funds Rate: Holding at 4.25–4.50%
Inflation: Slowing, but sticky in services and shelter
Powell: Still Chair - for now - but the Trump administration has begun the formal process to choose a successor
Scott Bessent: Treasury Secretary and current favorite to become next Fed Chair, according to fund manager surveys
Trump Fed Signaling: Explicitly pushing for sub-2% rates
Investor Positioning: Defensive - MMF balances remain elevated, yet institutional cash levels just triggered a “sell signal” at 3.9% of AUM
Liquidity is abundant, but allocation is fragmented - and positioning is not yet aligned with what the next regime may demand.
💧 The Liquidity Engine Is Primed
As outlined in Part I, liquidity isn’t just about central banks - it’s about where money sits and what conditions force it to move.
Today, U.S. money market funds hold $7.4 trillion - nearly double pre-COVID levels. This cash is yielding >5%, but that yield is structurally unsustainable if the Fed cuts.
If rate cuts begin - or even if markets gain confidence that the Fed will follow Trump’s sub-2% path - the opportunity cost of staying in cash explodes. The rotation begins.
🔁 Where the Capital Goes: Not All Rotations Are Created Equal
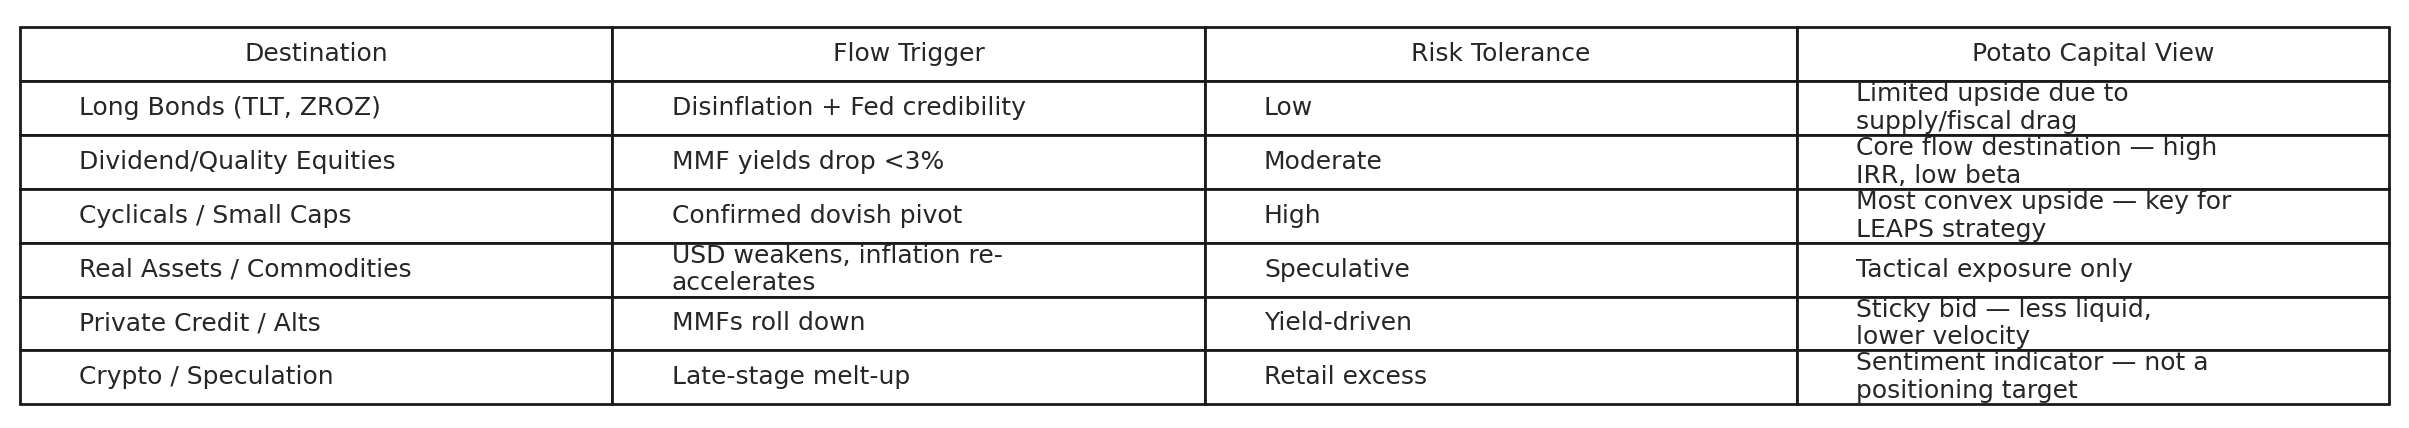
🔍 Why Equities May Lead This Time
We challenge the usual progression: bonds first, then equities.
This time, equities may lead the move due to:
Weak bond credibility: Deficits, QT, and Treasury issuance have impaired the “safe haven” bid
Higher forward IRRs in equities: Especially in underpriced cyclicals, small caps, and macro-levered names
Positioning fatigue in long-duration trades: “Short USD” is now the most crowded macro trade globally
Early signs of equity chase: Fund managers’ cash levels dropped to 3.9%, triggering a BofA “sell signal” for the first time since late 2021
The market is already sniffing the shift. Our job is to front-run its confirmation.
🧠 The Trump Fed Playbook
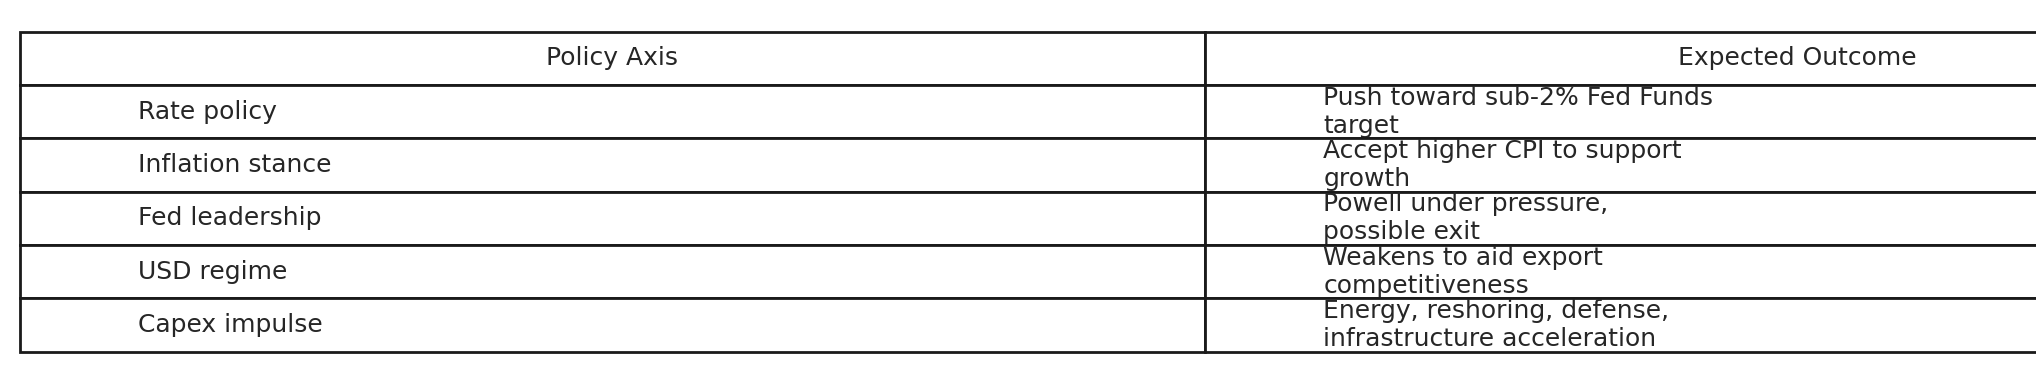
Bonus Insight: BofA surveys now show Scott Bessent as the most likely next Fed Chair. He would represent a high-velocity, growth-first pivot away from Powell’s inflation legacy. The shadow regime is already here.
🥔 Our Positioning: Ahead of the Rotation
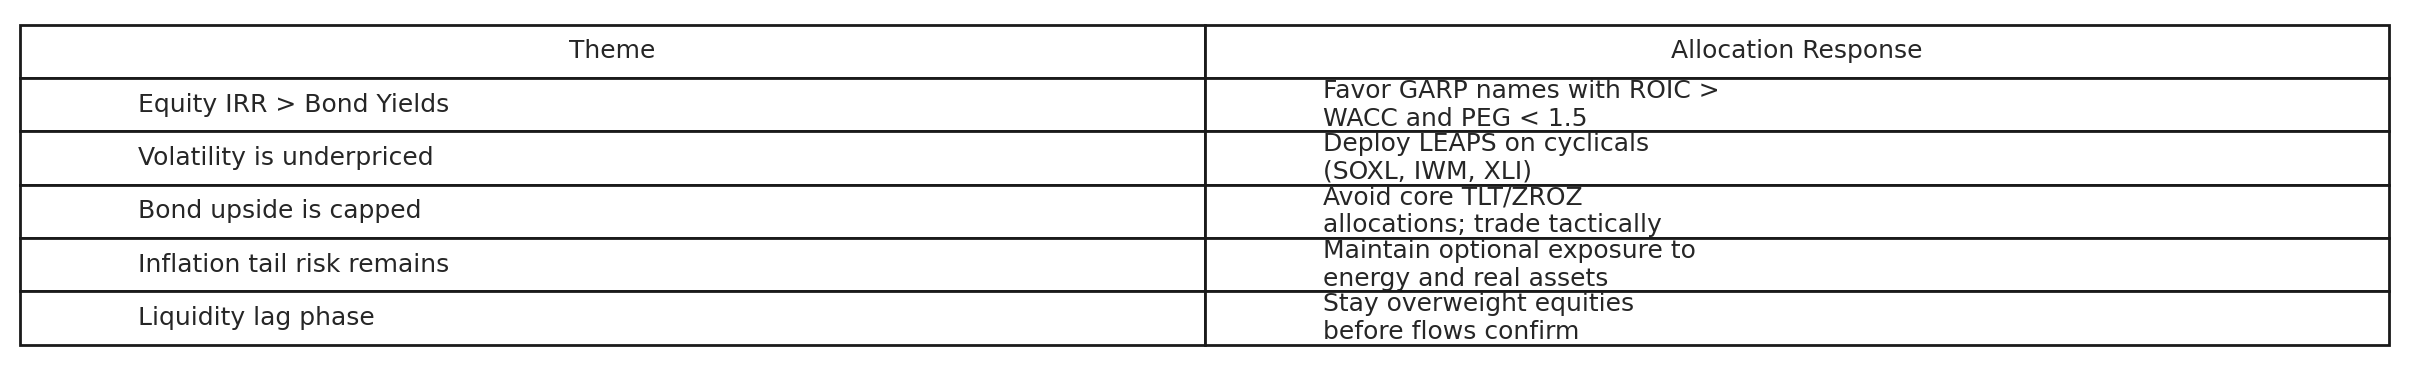
Potato Capital positioning is designed to:
Exploit mispriced upside in high-return, high-conviction equities
Stay long macro-convexity through LEAPS overlays (SOXL, IWM, XLI)
Trade duration tactically - not structurally - unless real yields collapse
Rotate toward energy, defense, and real assets only if inflation reaccelerates materially
🔮 The Scenario Playbook: What Triggers the Floodgate?
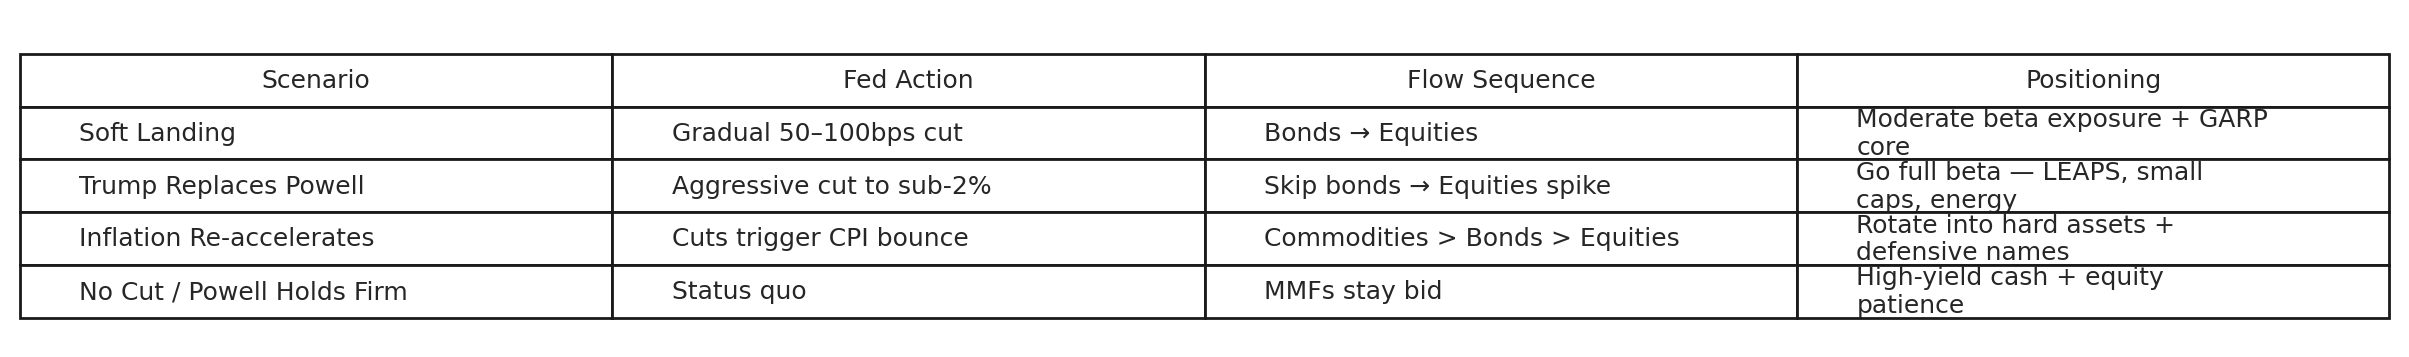
Every scenario has a liquidity outcome. Our edge lies in pre-positioning based on policy signaling, not reactionary trading.
🎯 Final Take: The Floodgate Is Real
This is not a theory post. It’s a forecast rooted in macro regime analysis, liquidity math, and investor psychology.
The cash is real
The regime is turning
The upside is asymmetric
When $7.4T begins to move, we won’t be chasing the flows - we’ll be where they’re headed.