

🥔 October 2025: The Great Yield Re-Anchoring
Liquidity fractures, fiscal overhang, and the slow restoration of risk premia across global markets
📌 Executive Summary - A market relearning the cost of capital
The defining feature of 2025 is a re-anchoring of yields as markets confront the reality of a world where the cost of capital once again matters.
A flood of sovereign duration supply is being absorbed into a financial system that is rich in cash but short on balance-sheet capacity. Roughly $7.4 trillion now sits in U.S. money-market funds, a record that highlights the divide between abundant liquidity and the ability to intermediate it. Dealers, banks, and leveraged investors are constrained by higher capital charges, thinner repo margins, and the retreat of central-bank balance-sheet support. The outcome is a rebuilding of the term premium even as inflation continues to cool. The yield curve’s recent re-steepening, modest but decisive, reflects issuance mechanics and balance-sheet strain more than any renewed inflation impulse.
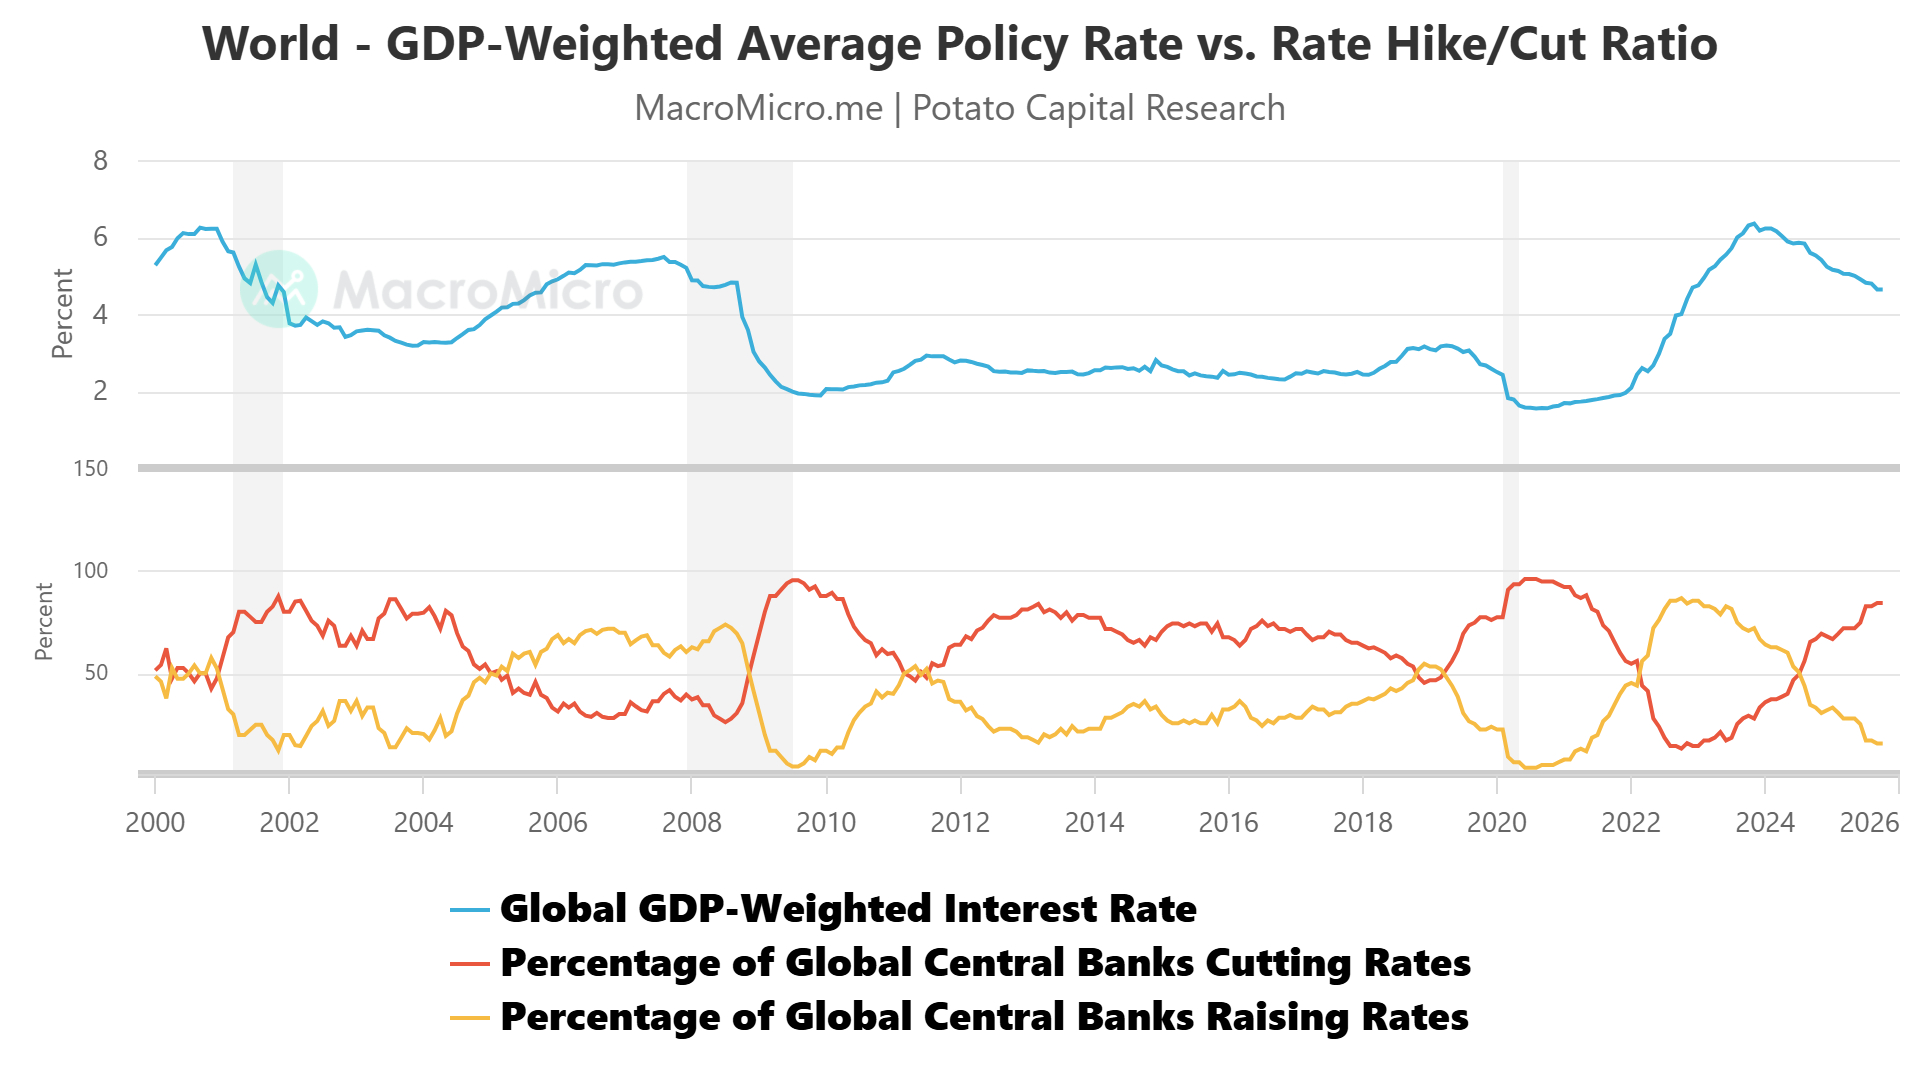
Globally, policy divergence is defining cross-market dispersion. The Federal Reserve is easing gradually from still-positive real rates, with our base case calling for two 25 bps cuts by year-end and an optimistic path of three if core services inflation softens further. The European Central Bank is cutting into stagnation and residual energy pressure, while the Bank of Japan is gingerly testing an exit from yield control. These cross-currents reinforce a firm U.S. dollar, uneven foreign-exchange volatility, and a tighter link between real yields, equity valuations, and funding spreads as the cost of capital settles into a higher equilibrium.
The market has entered a balance-sheet-constrained, term-premium phase in which carry and convexity matter again.
Unhedged beta exposure is vulnerable, while opportunities lie in instruments that pay investors to hold optionality and manage duration actively. We favor high-quality cash-flow compounders, investment-grade over high yield, and selective long-volatility positions financed with carry. In short, 2025 marks the transition from a liquidity-driven market to one governed once again by the price of time.
💧 Liquidity & Yields - The Collateral Squeeze Phase
The defining feature of U.S. money markets in late 2025 is the near-depletion of the Federal Reserve’s overnight reverse-repo (ON RRP) facility.
Usage has collapsed to near zero (from > $2.6 T in 2023), erasing what had functioned as the system’s residual liquidity buffer. With that cushion gone, money-market funds are competing aggressively for Treasury bills and secured repo, tightening conditions across collateral markets and pushing the price of safety higher.
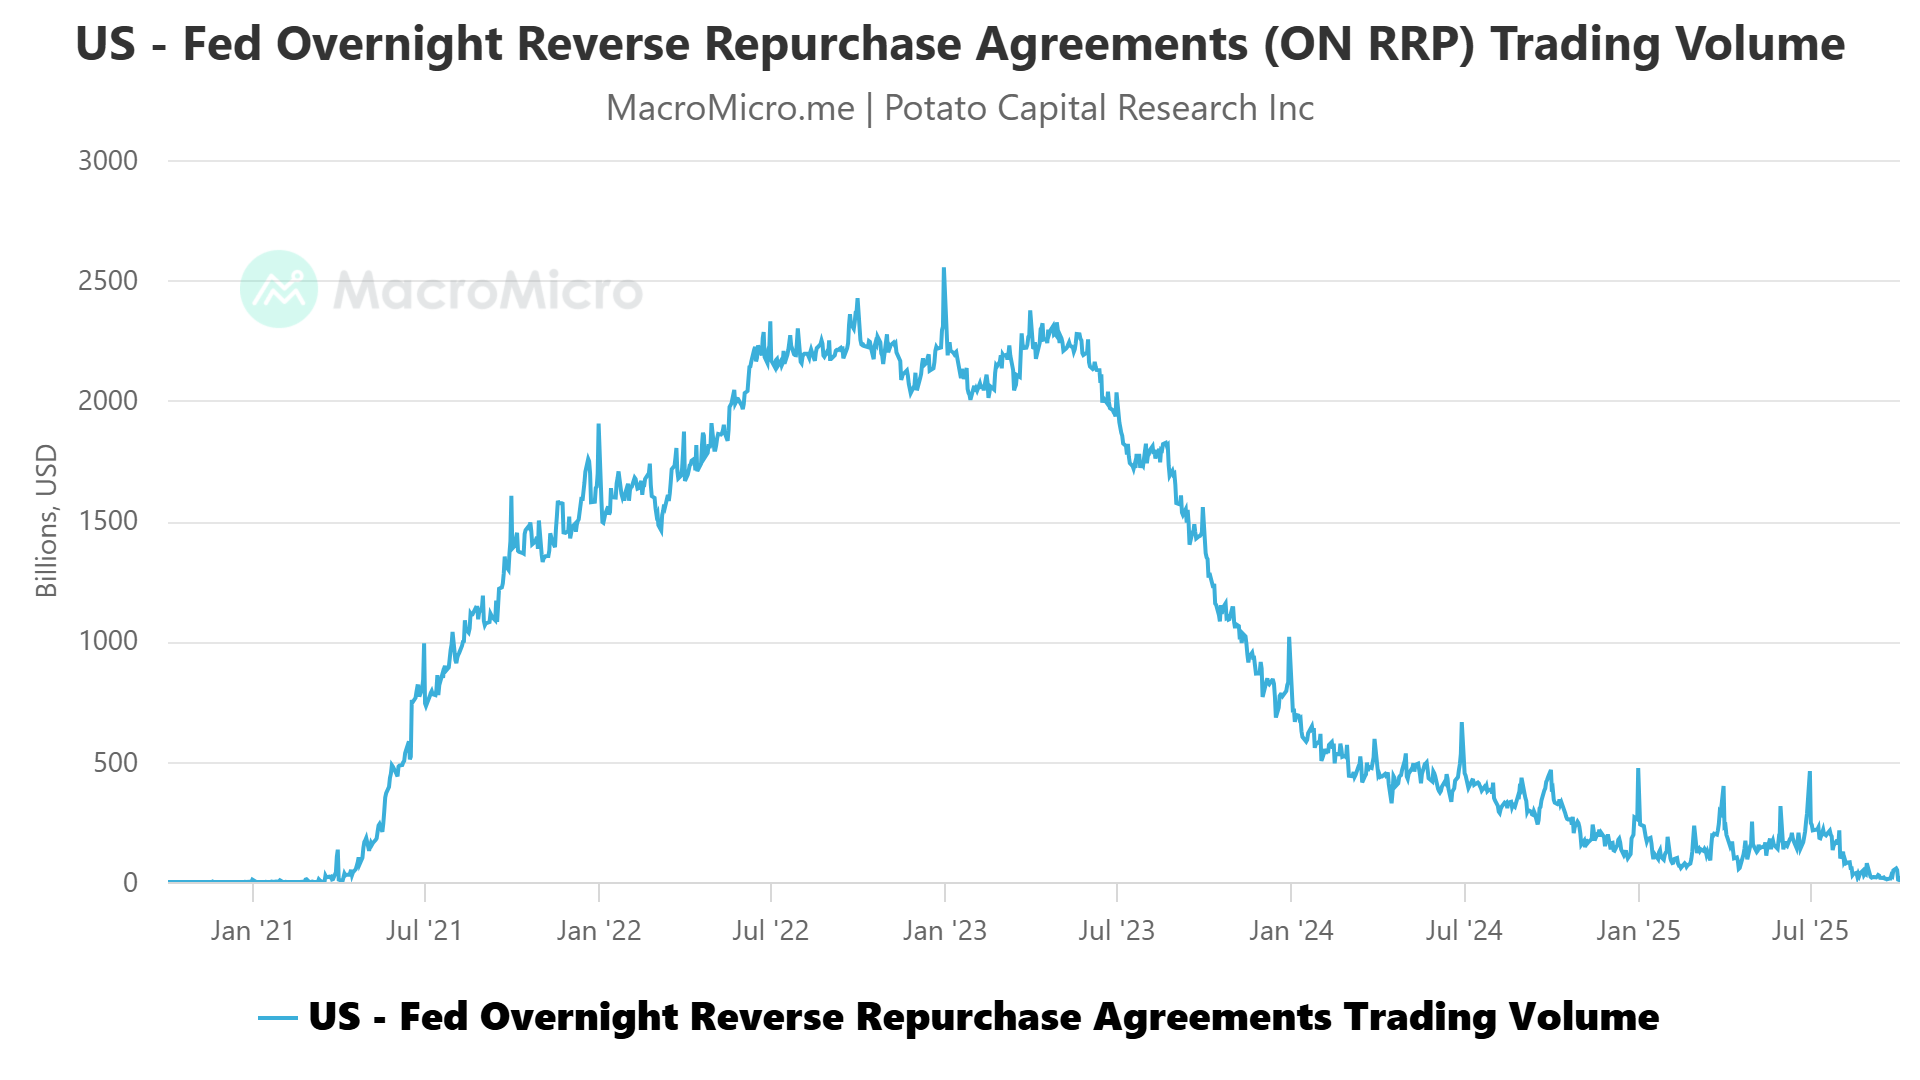
This exhaustion has marked the transition from a world of excess reserves to one of collateral scarcity. The result is a repricing of duration not because inflation has reignited, but because duration supply is colliding with limited balance-sheet capacity.
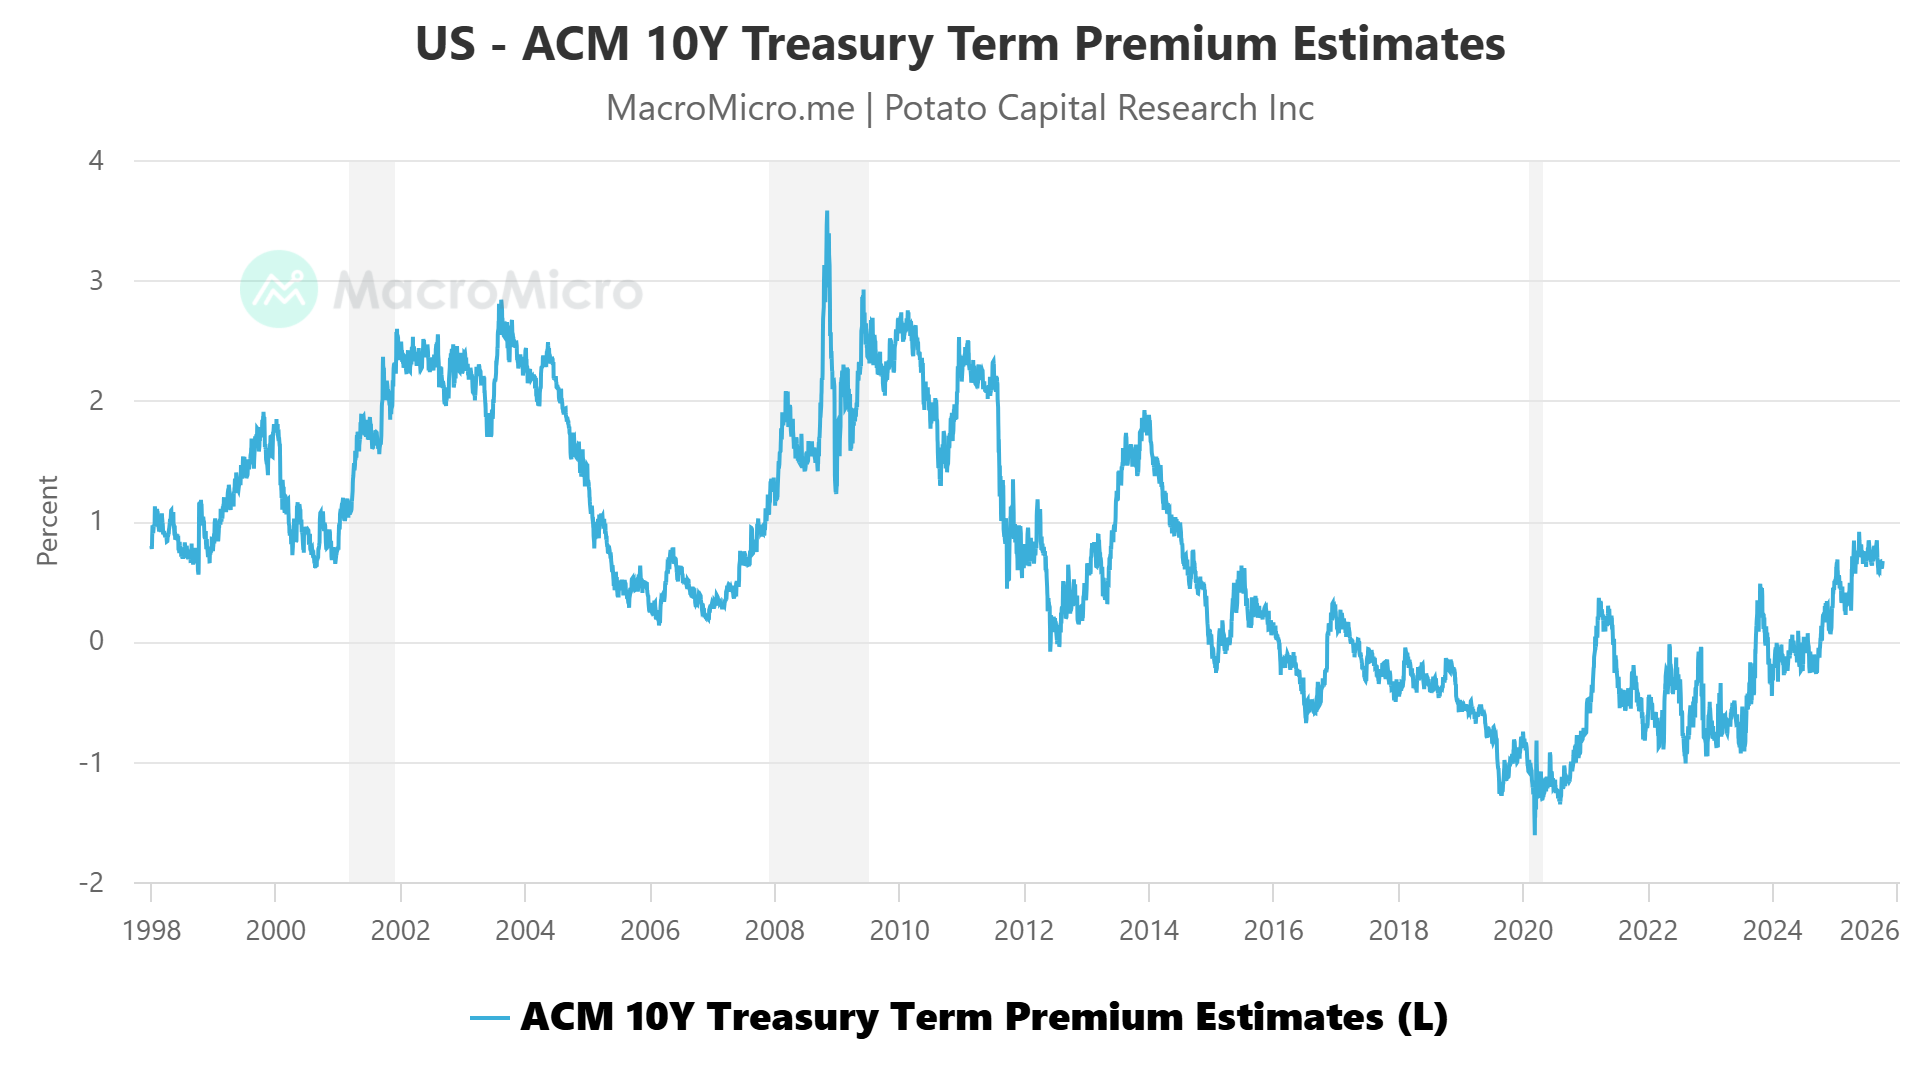
The ten-year yield today reflects two distinct components:
(1) the expected path of short-term policy rates, and
(2) the term premium - the additional compensation investors demand to hold long-dated securities.
It is the second component that has done the heavy lifting. Since mid-year, the term premium has risen by about 50 basis points to roughly 0.7%, adding that amount to the ten-year yield even as inflation expectations stayed stable.
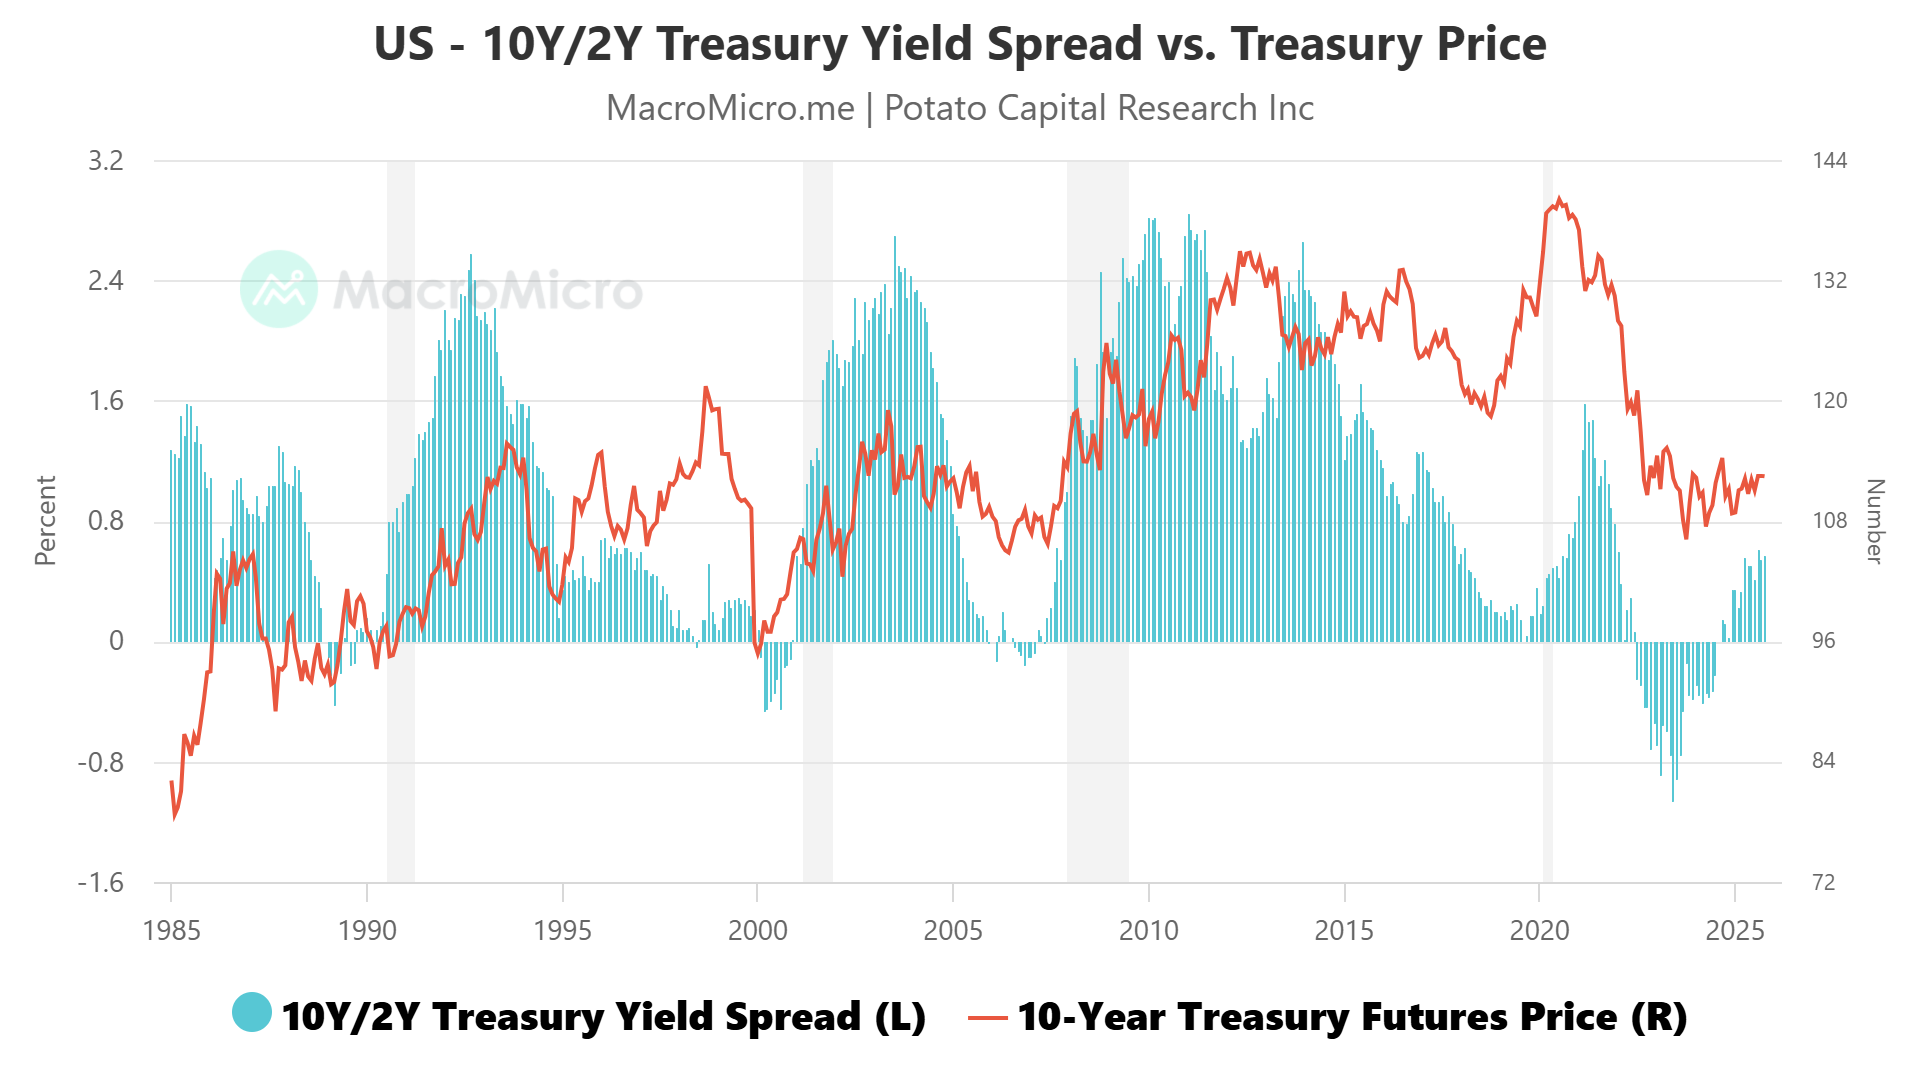
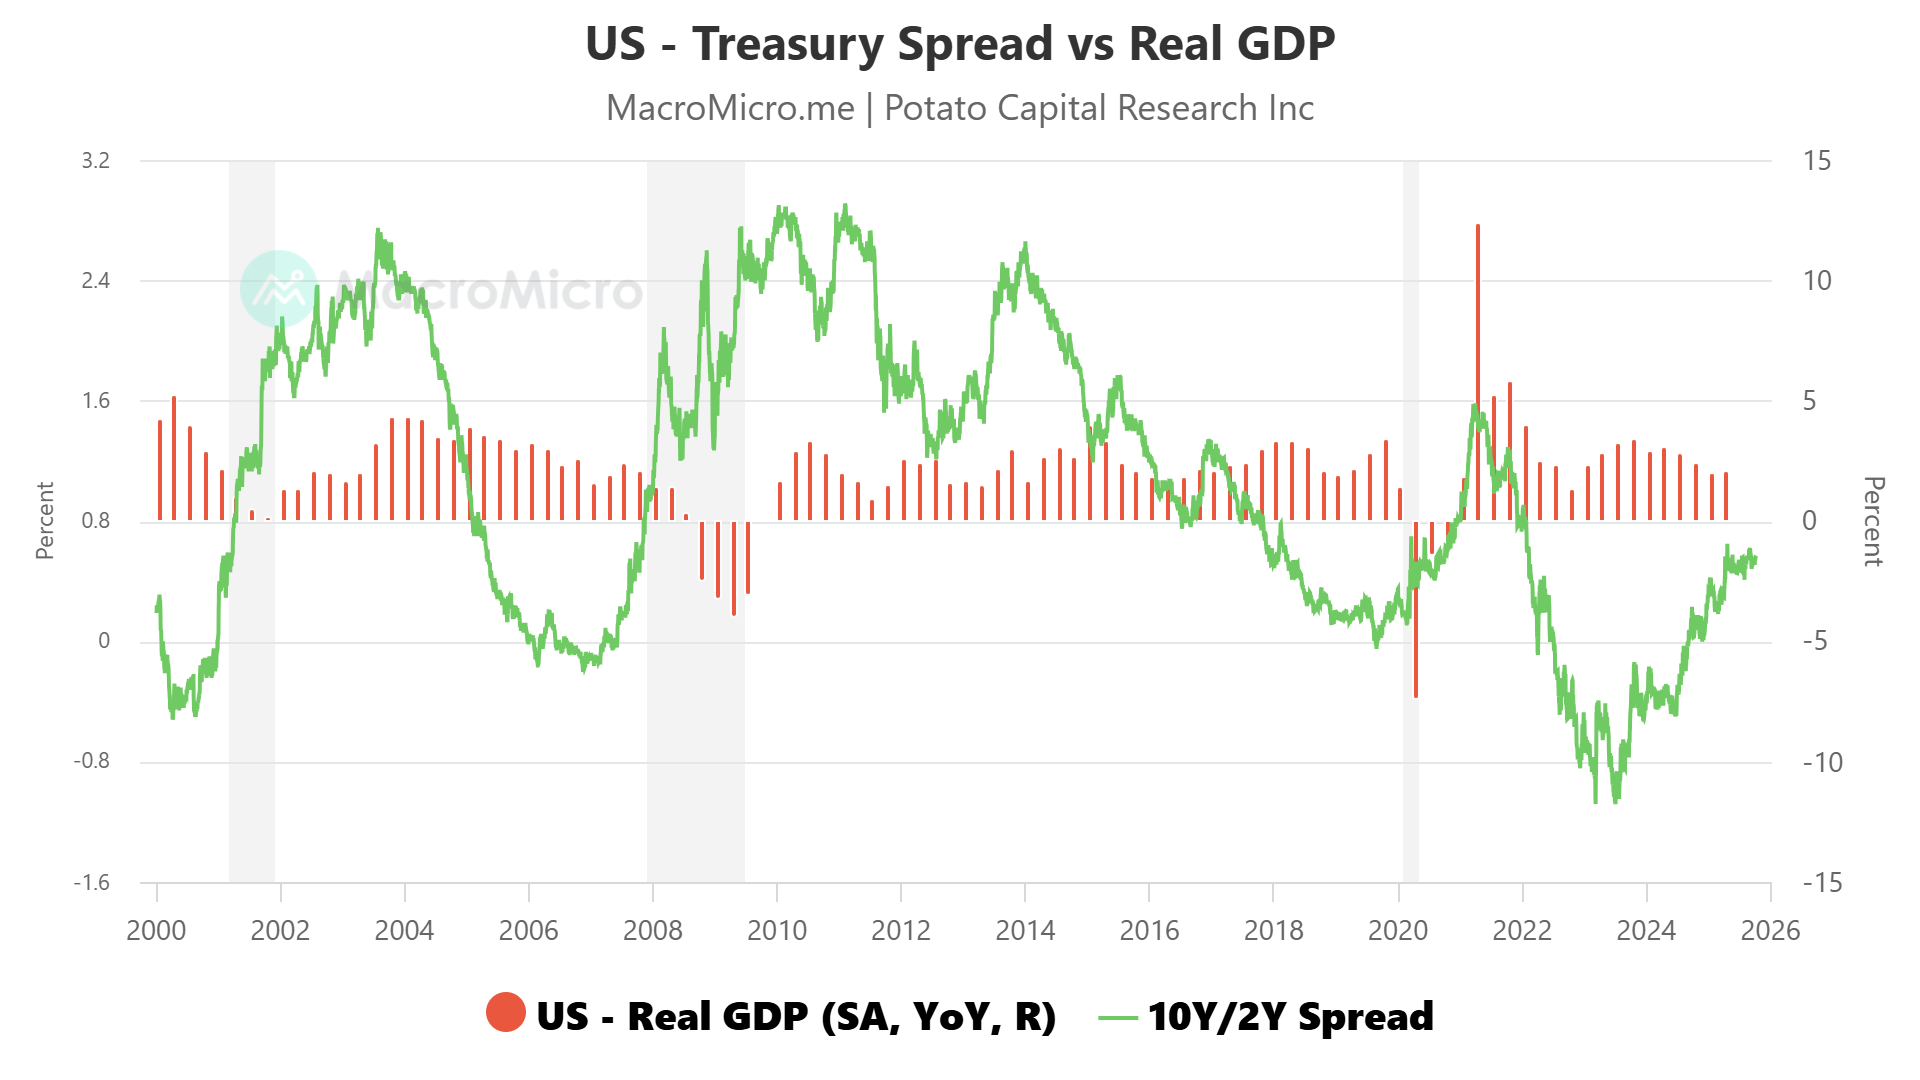
This dynamic explains why the curve can steepen, and even turn modestly positive, without an inflation shock. The 2s10s spread, which bottomed near -100 bps in 2024, has now moved modestly positive (+0.53%), signaling normalization driven by fiscal supply and balance-sheet mechanics rather than growth exuberance.
Two empirical relationships reinforce this interpretation:
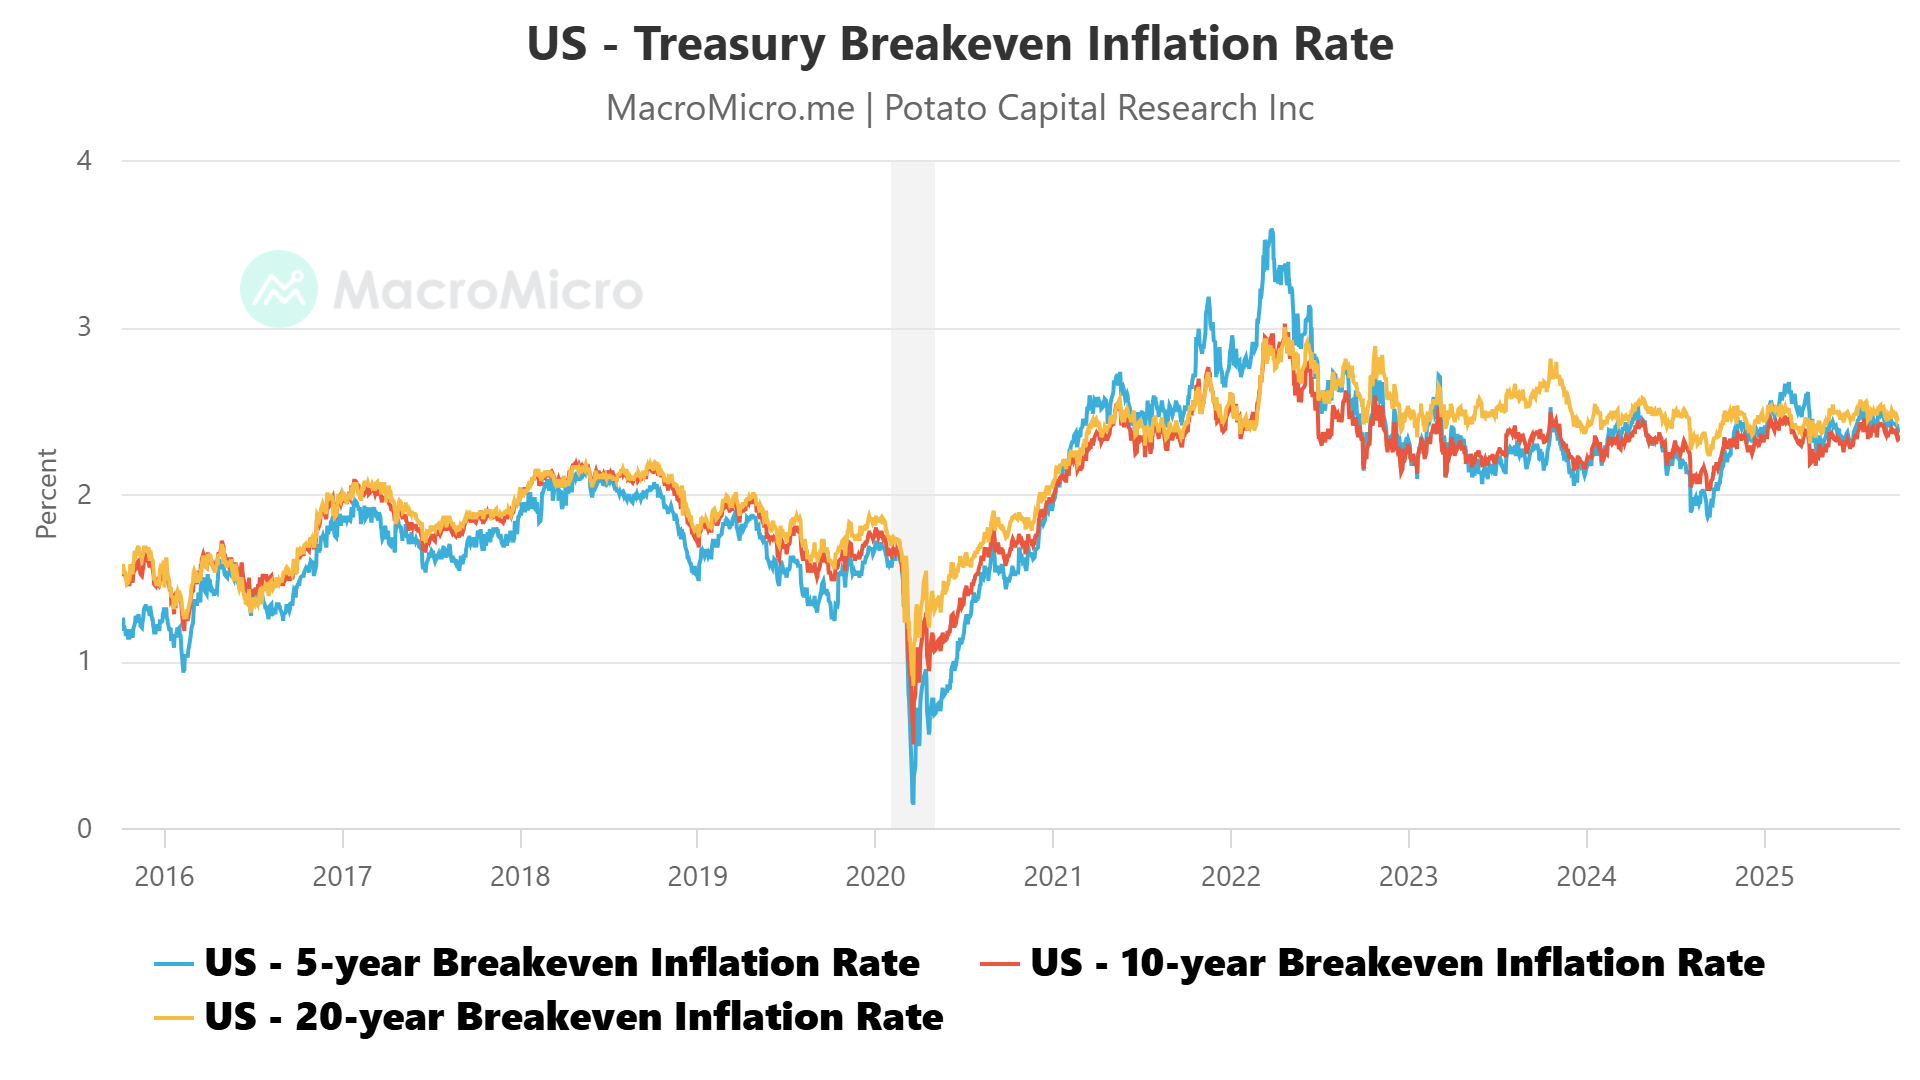
Macro co-movement: In classical growth scares, breakevens compress while real yields decline. Instead, breakevens have been locked in a narrow 2.2-2.4 percent corridor while real yields and the curve have adjusted; clear evidence that supply and balance-sheet factors, not inflation risk, are steering rates.
Growth vs rates: Mapping the yield curve against real GDP growth shows the shift from an inflation-fear regime to one defined by fiscal issuance and private balance-sheet limits.
Portfolio Implications
Duration: Favor 7- to 10-year Treasuries as a carry-plus-convexity expression. If the move remains supply-driven, investors are paid to hold; if growth softens, convexity provides upside.
Curve: Maintain a measured steepener bias, acknowledging that the first leg of re-steepening is complete and future gains will be more path-dependent.
Equities: Persistently higher real yields cap multiple expansion; companies with strong balance sheets and internal funding should continue to outperform broad beta.
Funding: Monitor repo-OIS and GC spreads as early-warning indicators of stress. With the RRP buffer gone, collateral scarcity can transmit more abruptly through funding markets.
🔥 Inflation Dynamics - Sticky vs. Flexible and the Last Mile
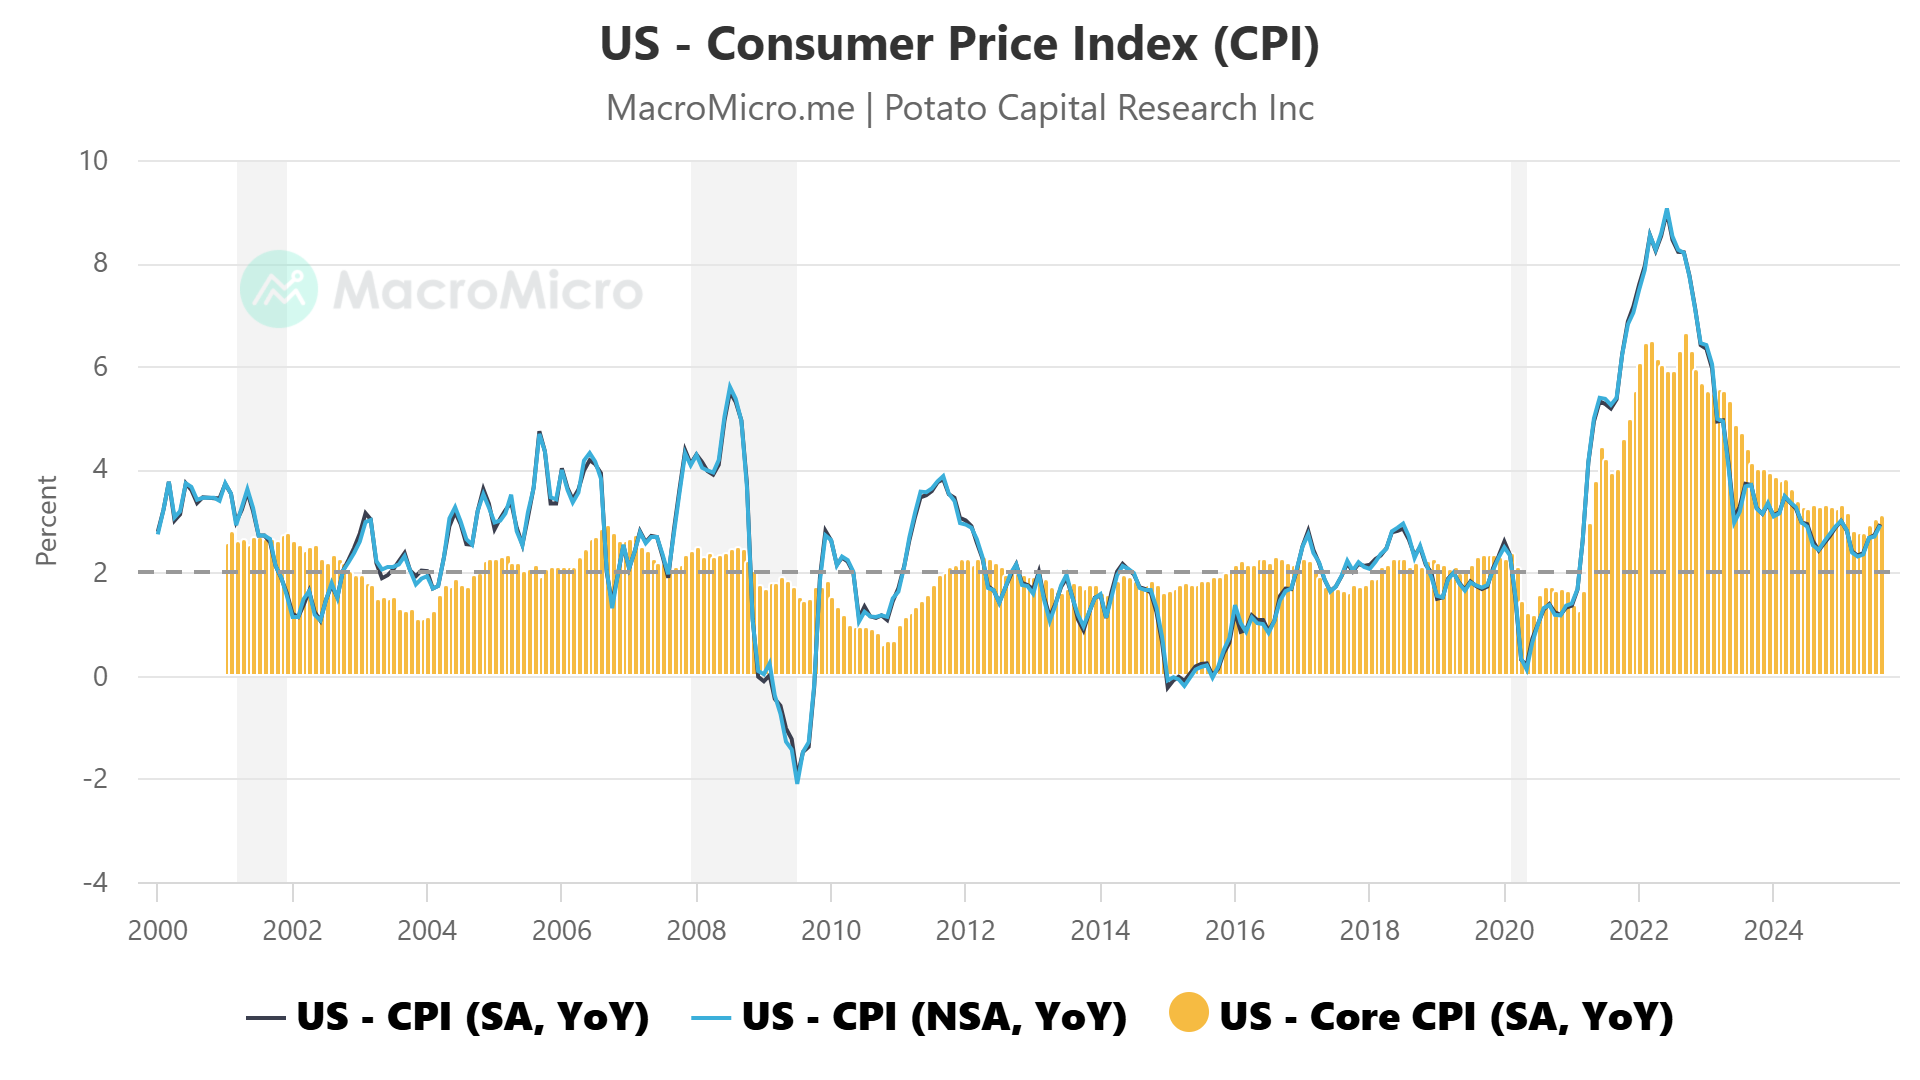
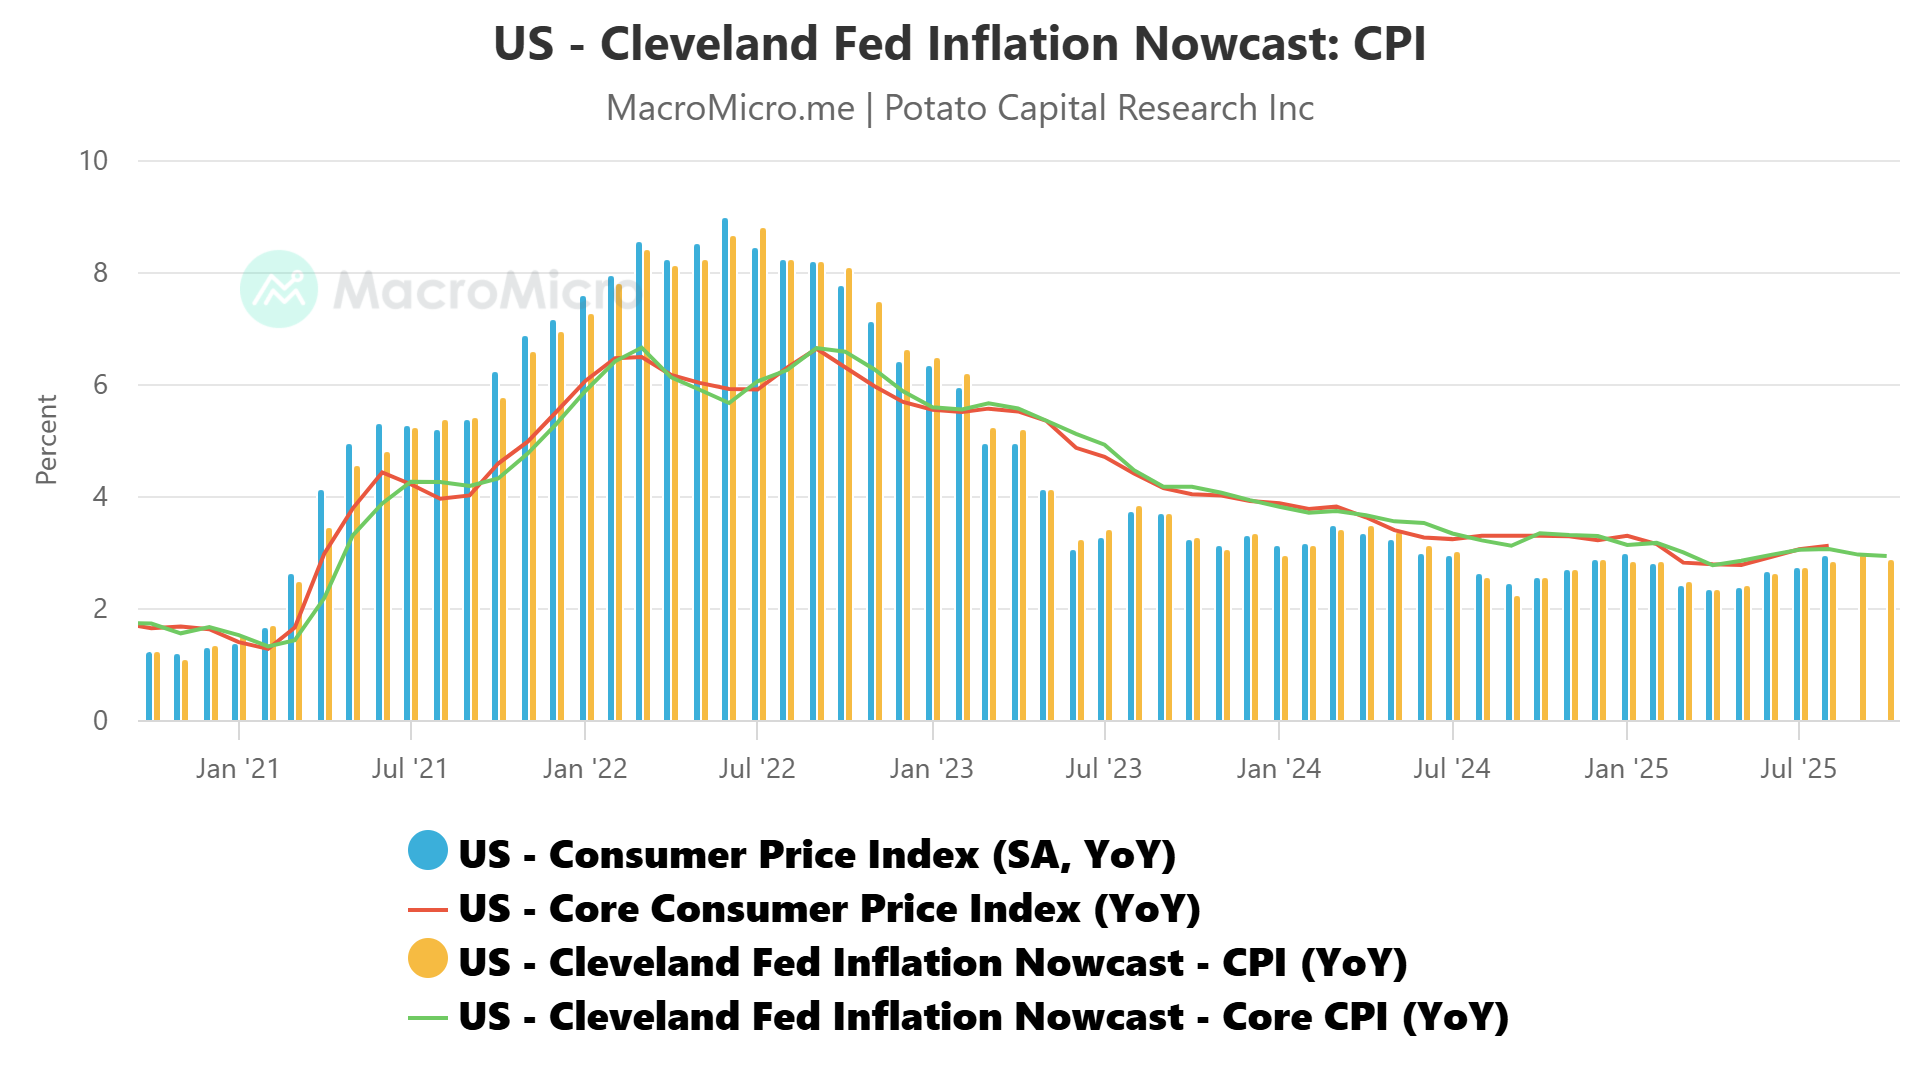
Headline inflation has completed the easy phase of disinflation. Flexible components - energy, autos, and other traded goods - have cooled sharply or turned negative, while sticky categories such as shelter, medical services, and other labor-intensive segments remain elevated. The divergence between the two is the clearest sign that inflation’s “last mile” will be harder to achieve.
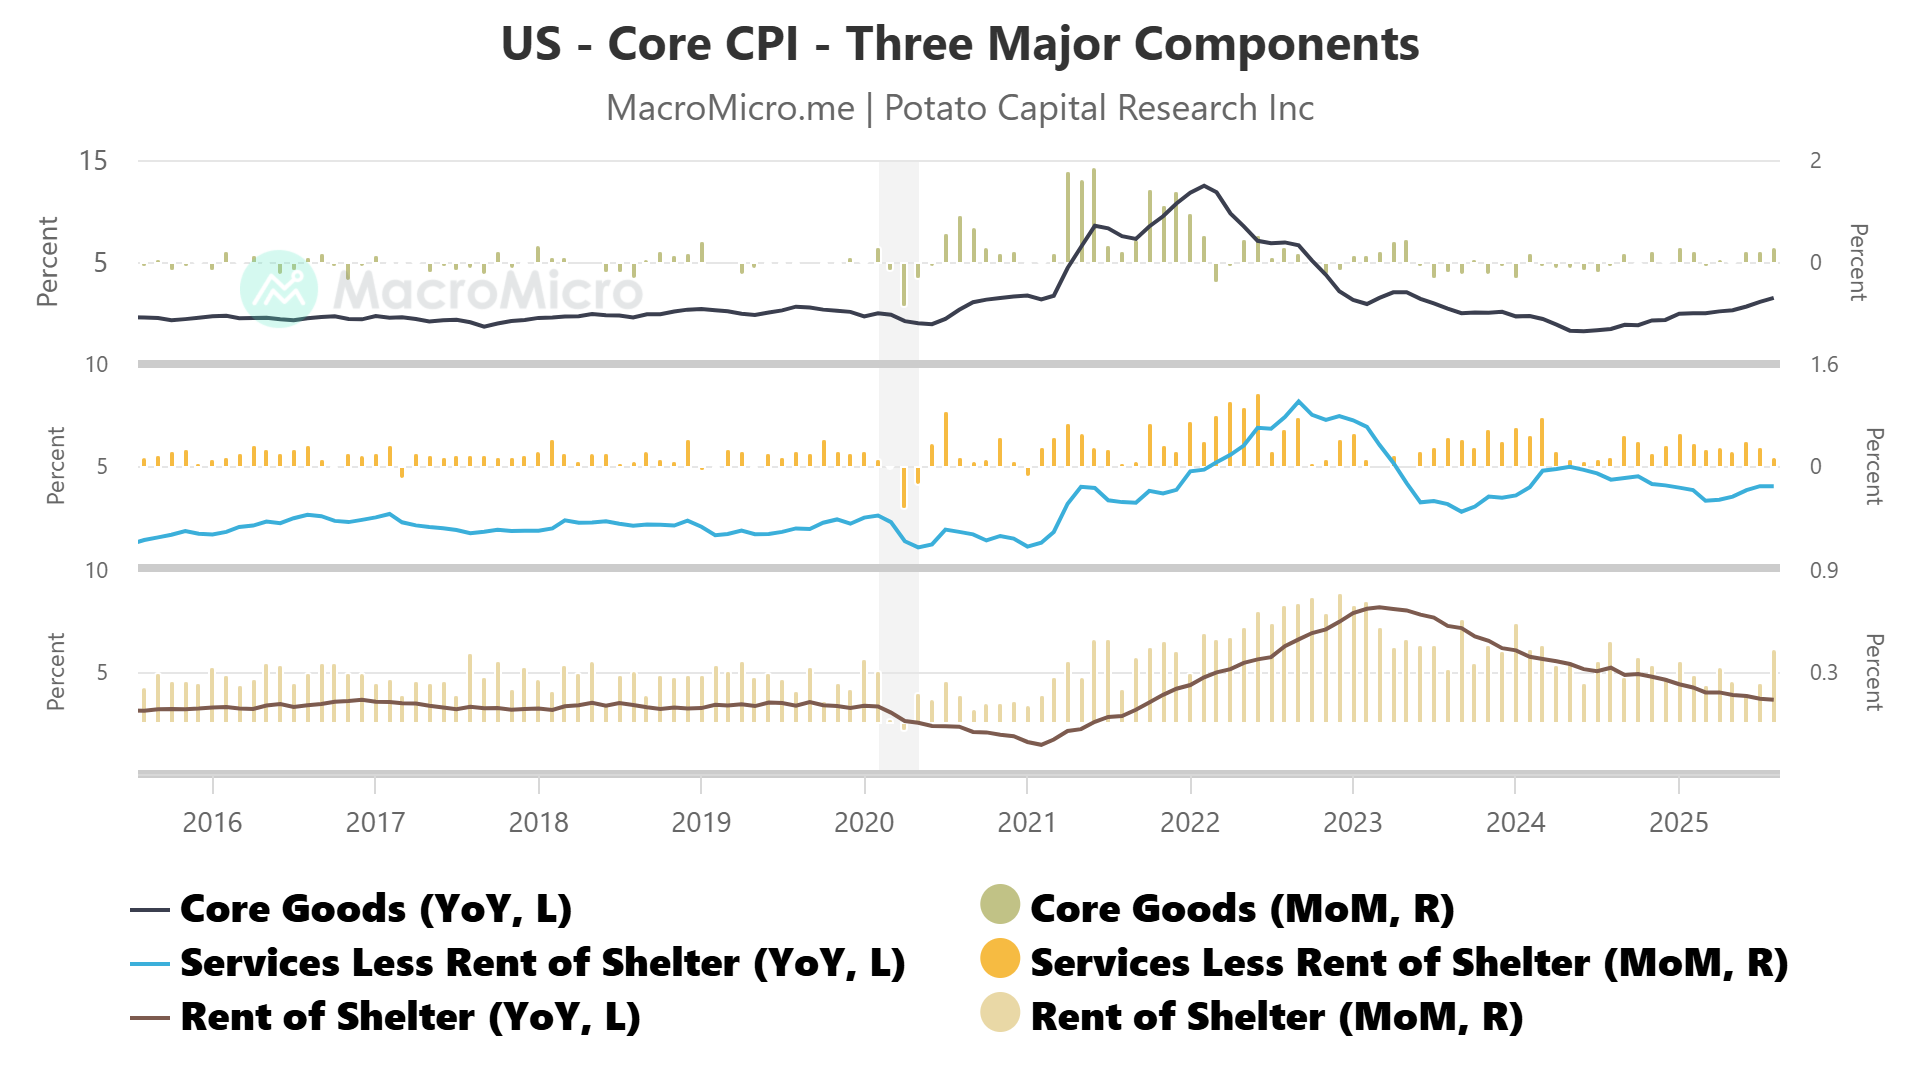
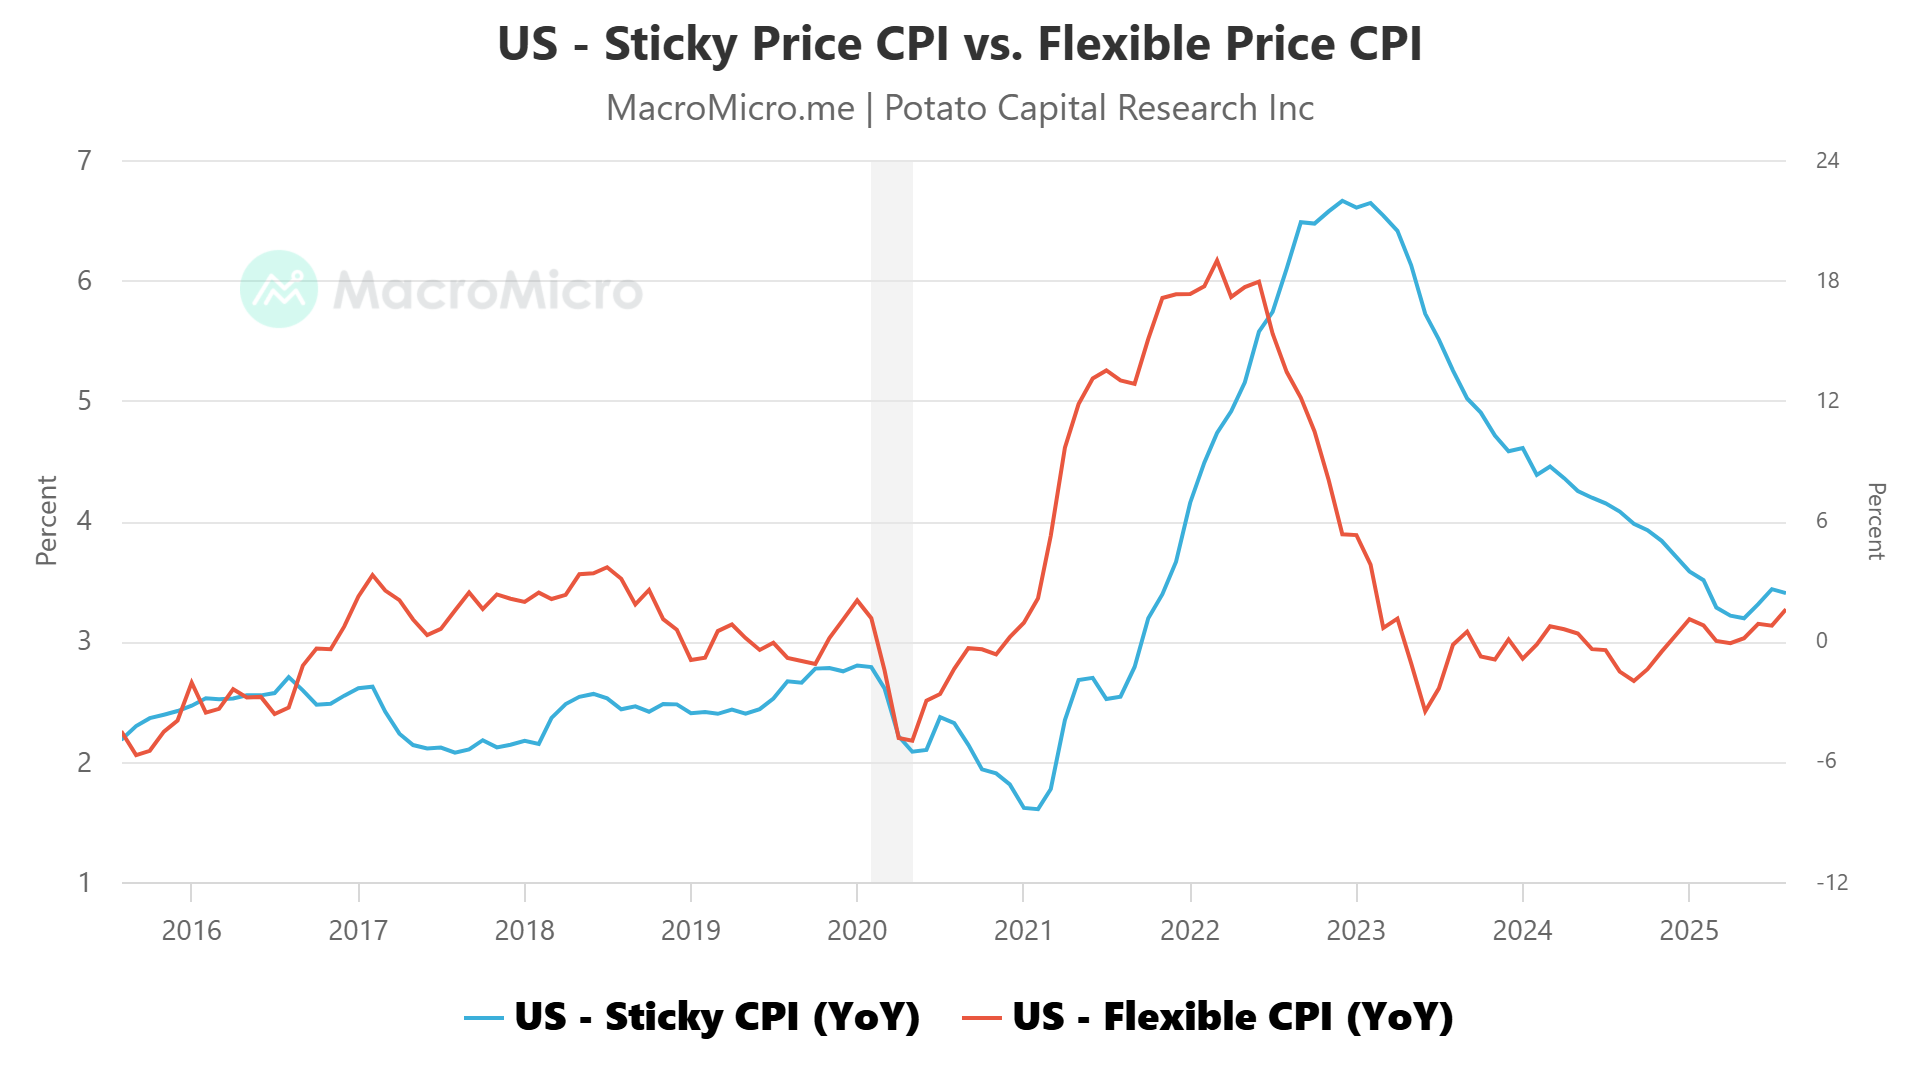
Policymakers focus on these slow-moving components because they capture underlying inflation inertia.
Even with headline CPI below 3%, core services inflation running in the mid-3s to 4% range, depending on series (CPI vs PCE), keeps real policy rates restrictive and the Fed cautious about easing too quickly.
This is why, despite market pricing for two cuts by year-end, the Fed continues to emphasize data-dependence and patience in achieving a sustainable 2% trajectory.
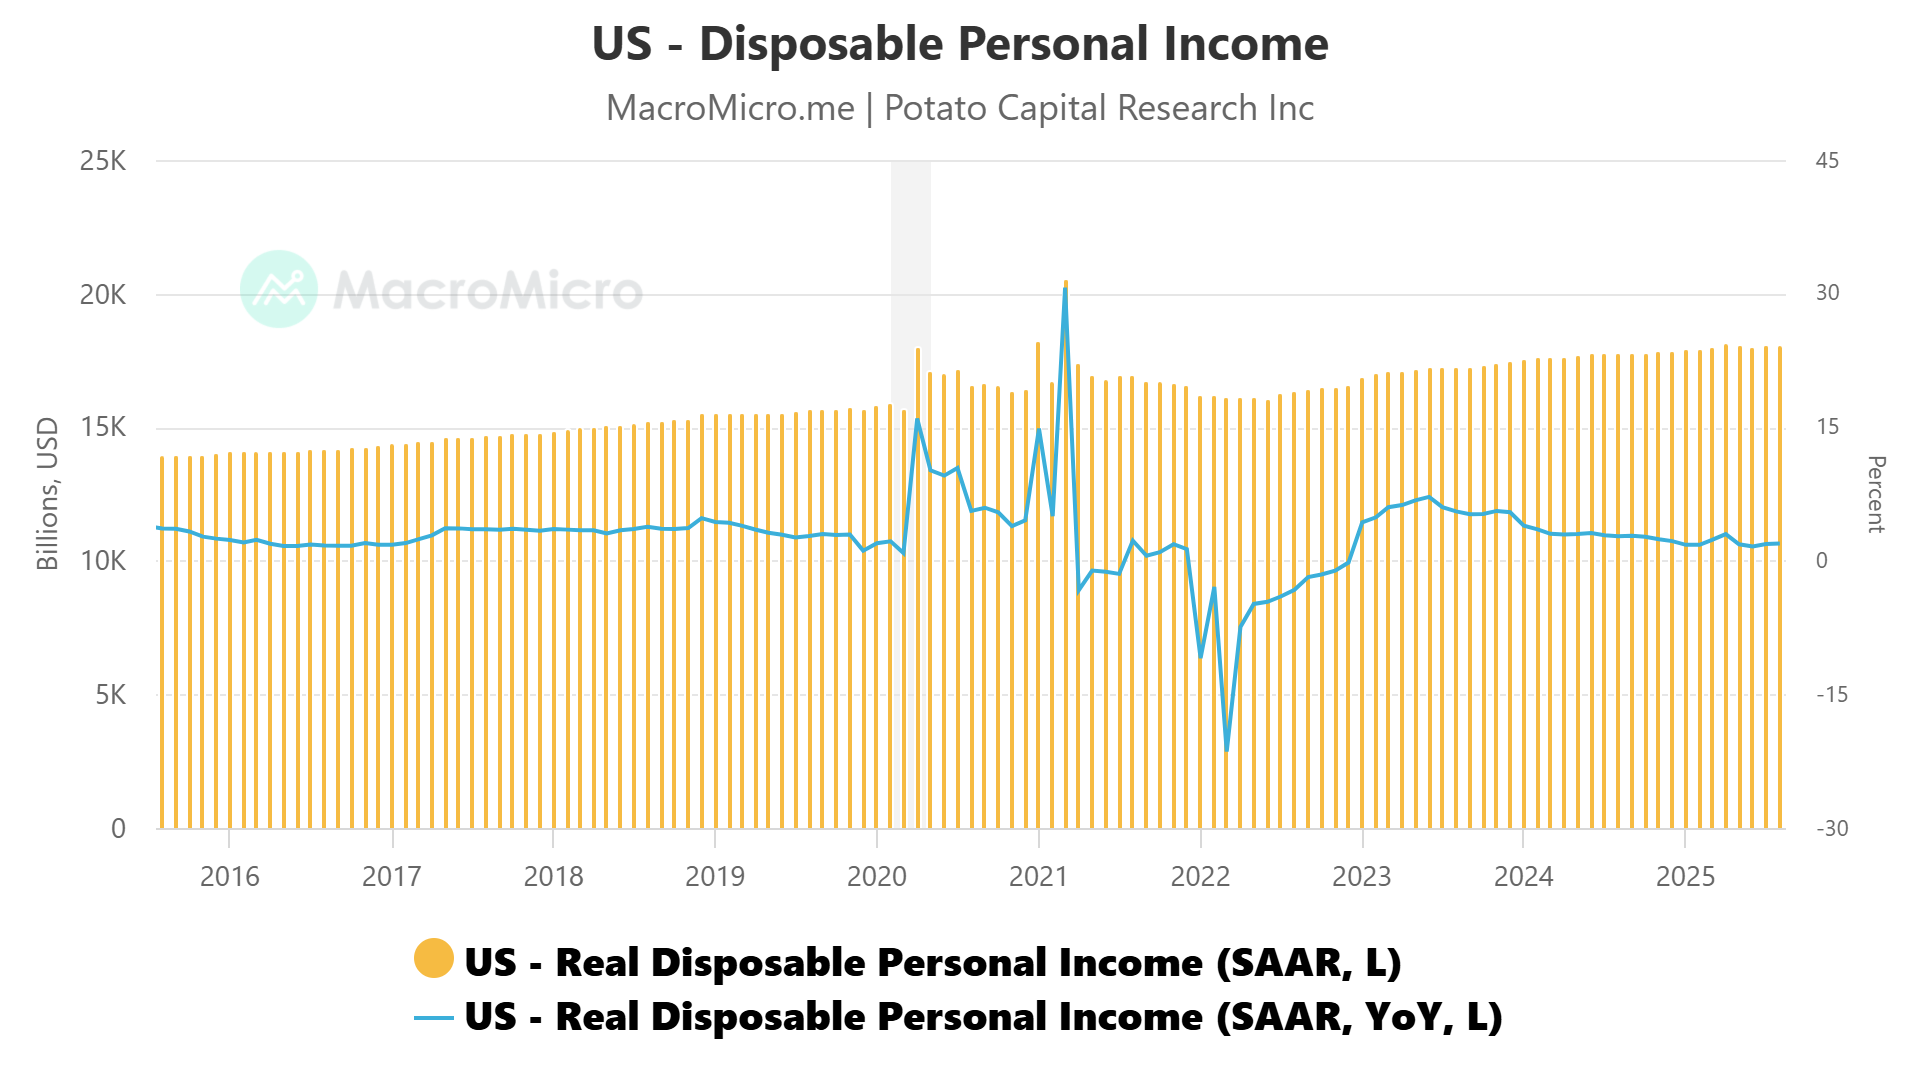
The shift is also visible in household and demand data. Real personal consumption expenditures have slowed and become more volatile, reflecting the fading of fiscal support and the exhaustion of pandemic-era savings. Consumers are trading down within categories, with discretionary spending flattening even as nominal wages hold steady.
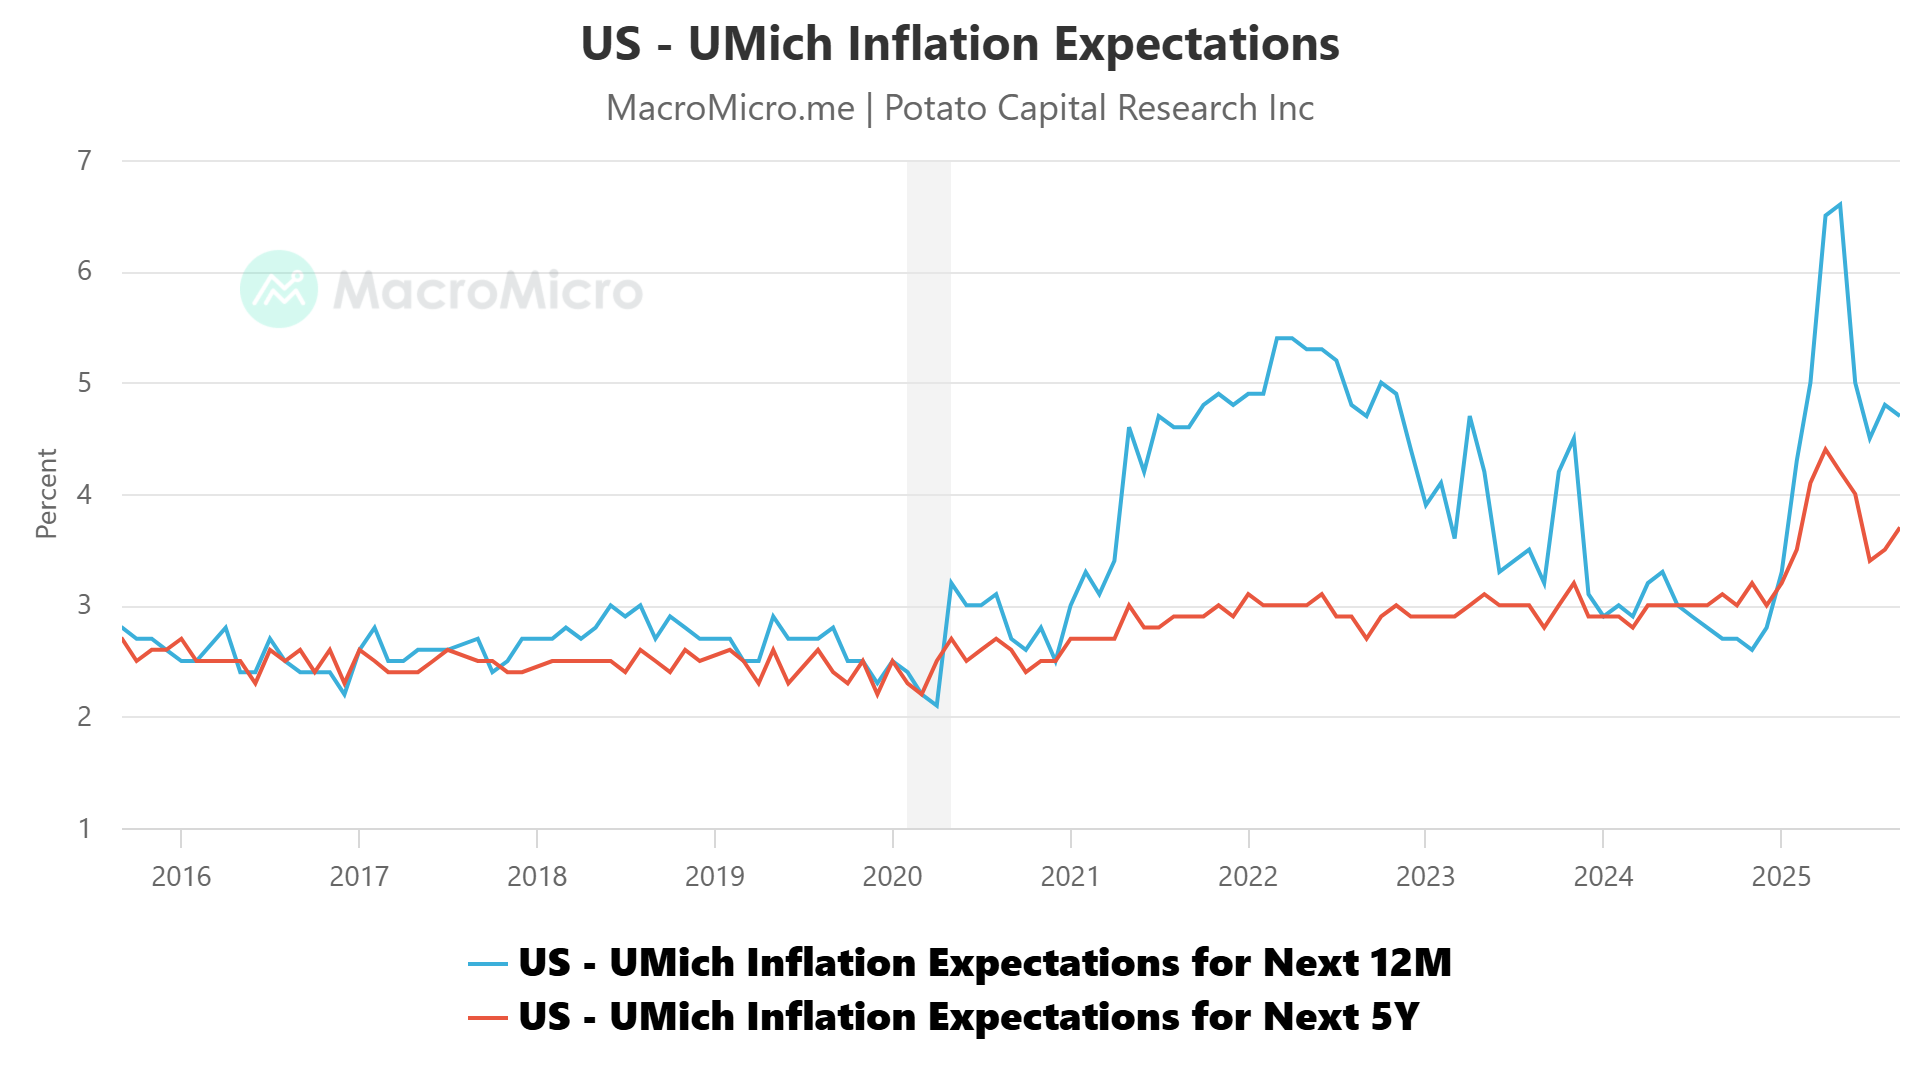
Long-term inflation expectations in the University of Michigan survey have eased from 2024 highs but still hover in the 3-4 % range (most recent ~3.7%), keeping the Fed uncomfortable declaring victory.
Together, these elements define the current stance: moderate policy easing while maintaining positive real rates.
The Fed can afford to cut modestly, to normalize financial conditions and ease funding strains, but not aggressively enough to reflate demand. This is the equilibrium of the “last mile”: a slow glide path rather than a reset.
Investor Implications
Breakevens: Intermediate maturities (5–10 years) remain below long-term averages and provide cheap insurance if growth slows but policy normalization stalls. TIPS in this range offer convexity and diversification benefits.
Equity factors: Gradual erosion in sticky inflation favors pricing power and low capital intensity. Quality and margin resilience outperform; deep cyclicals reliant on cheap financing remain disadvantaged.
Rates beta: Avoid broad front-end shorts. The “last-mile” nature of disinflation argues for policy staying restrictive longer, but the risk/reward for additional tightening is poor now that the hiking cycle has ended.

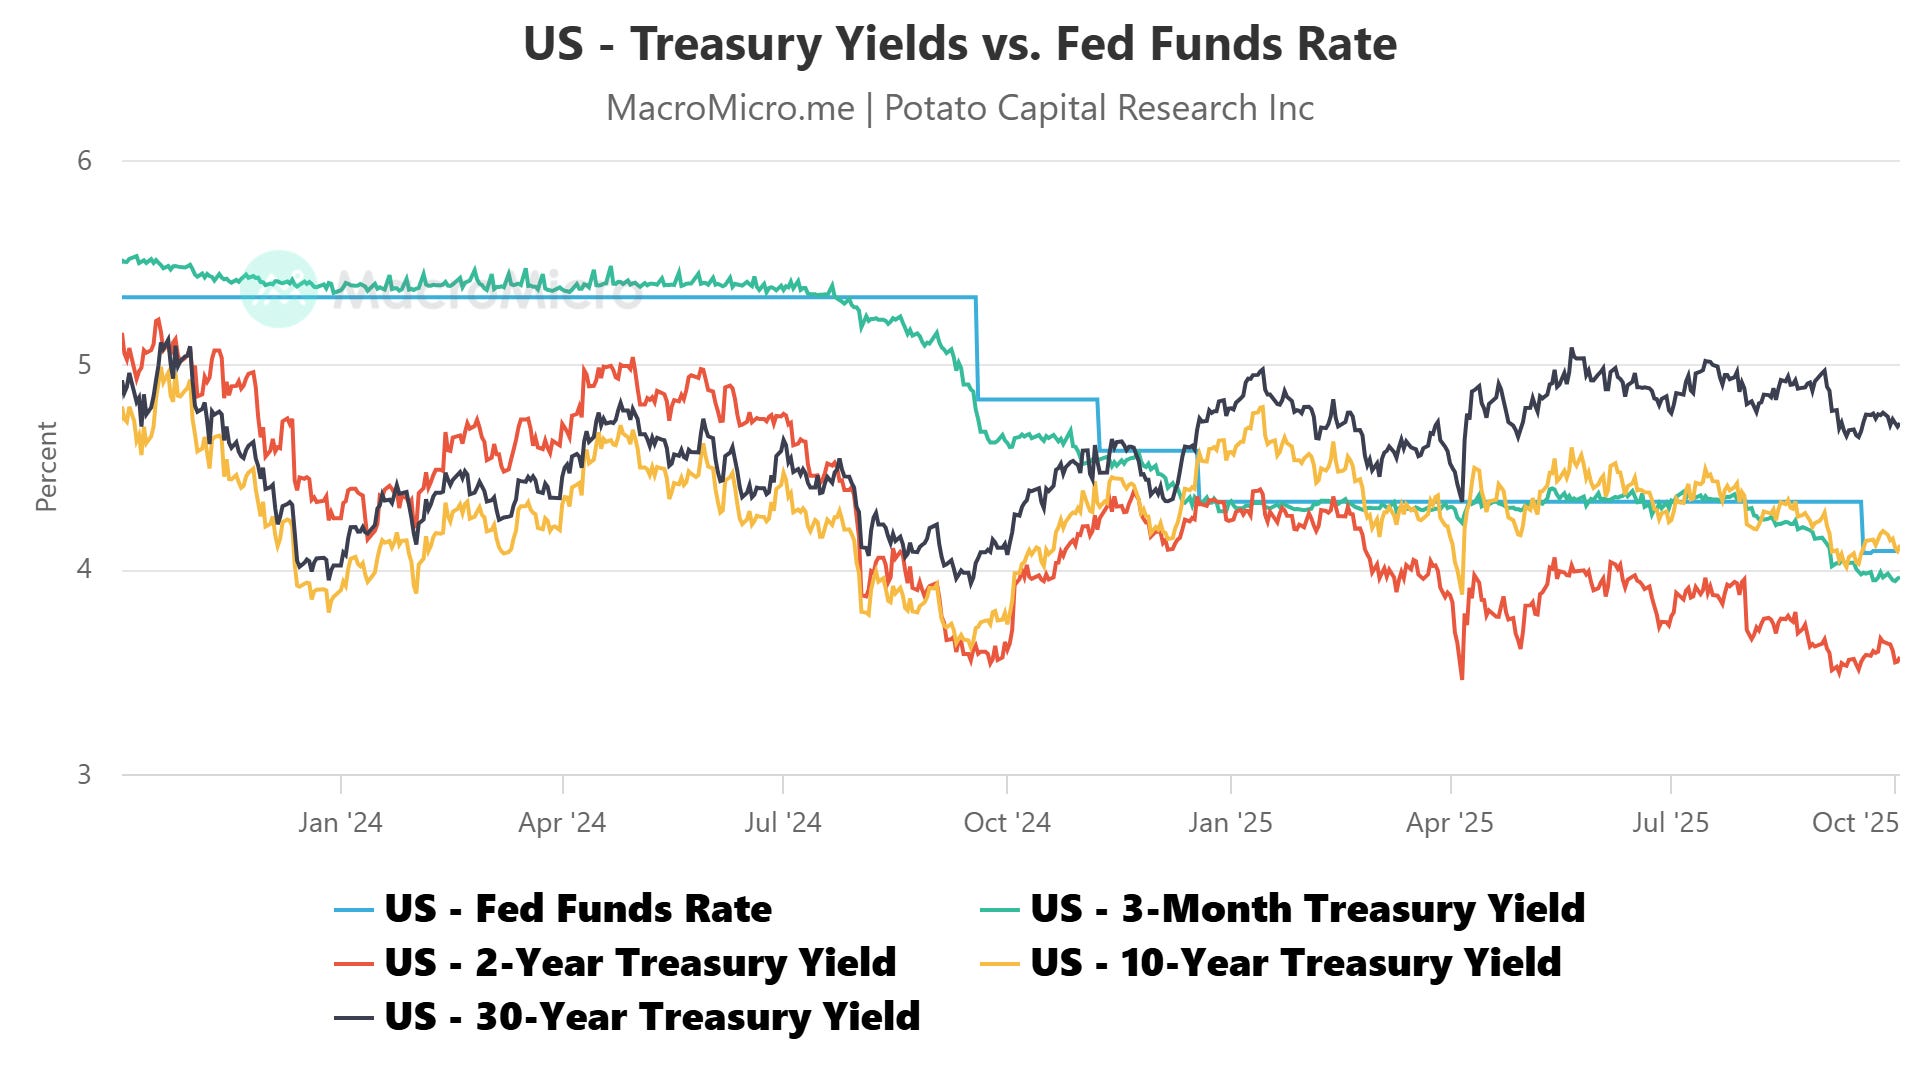
Fed funds path vs. market-implied policy rate expectations
📈 Growth Composition - What’s Real, What’s Inventory, and What’s Signal
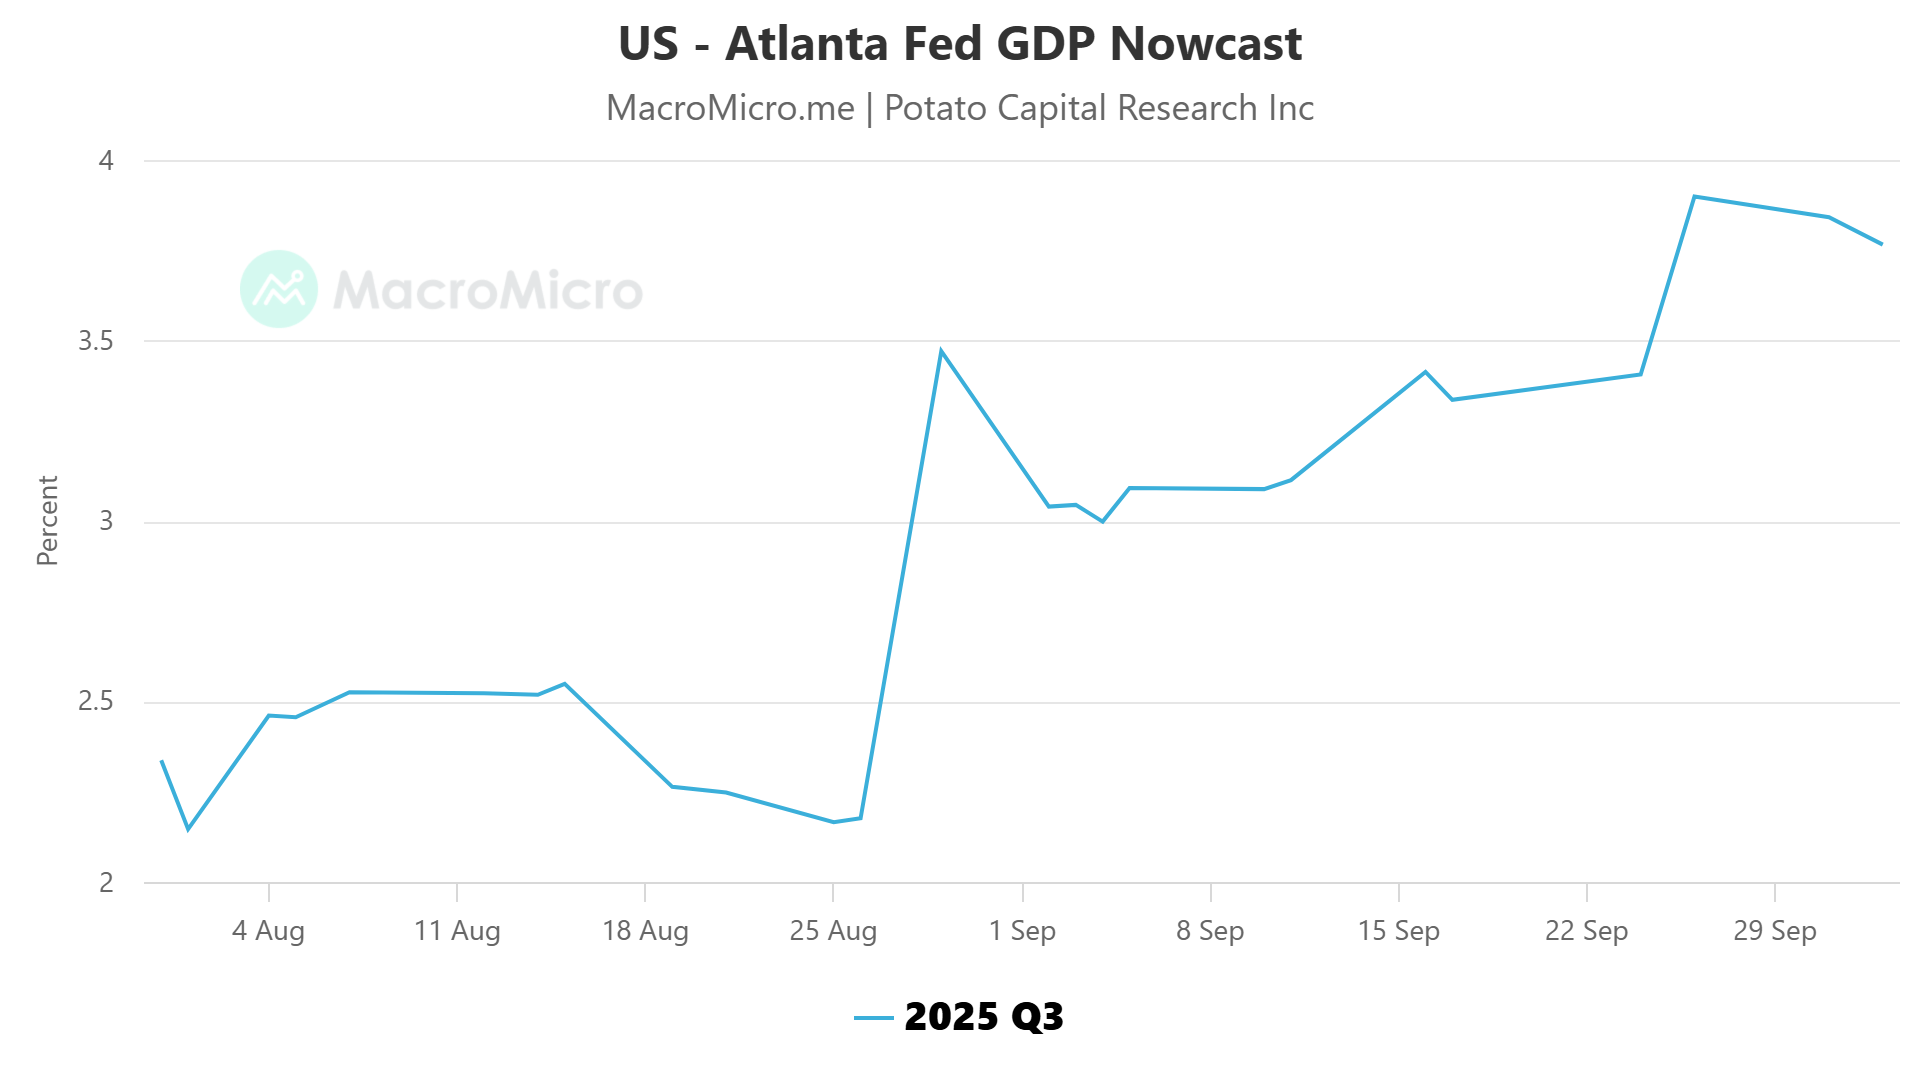
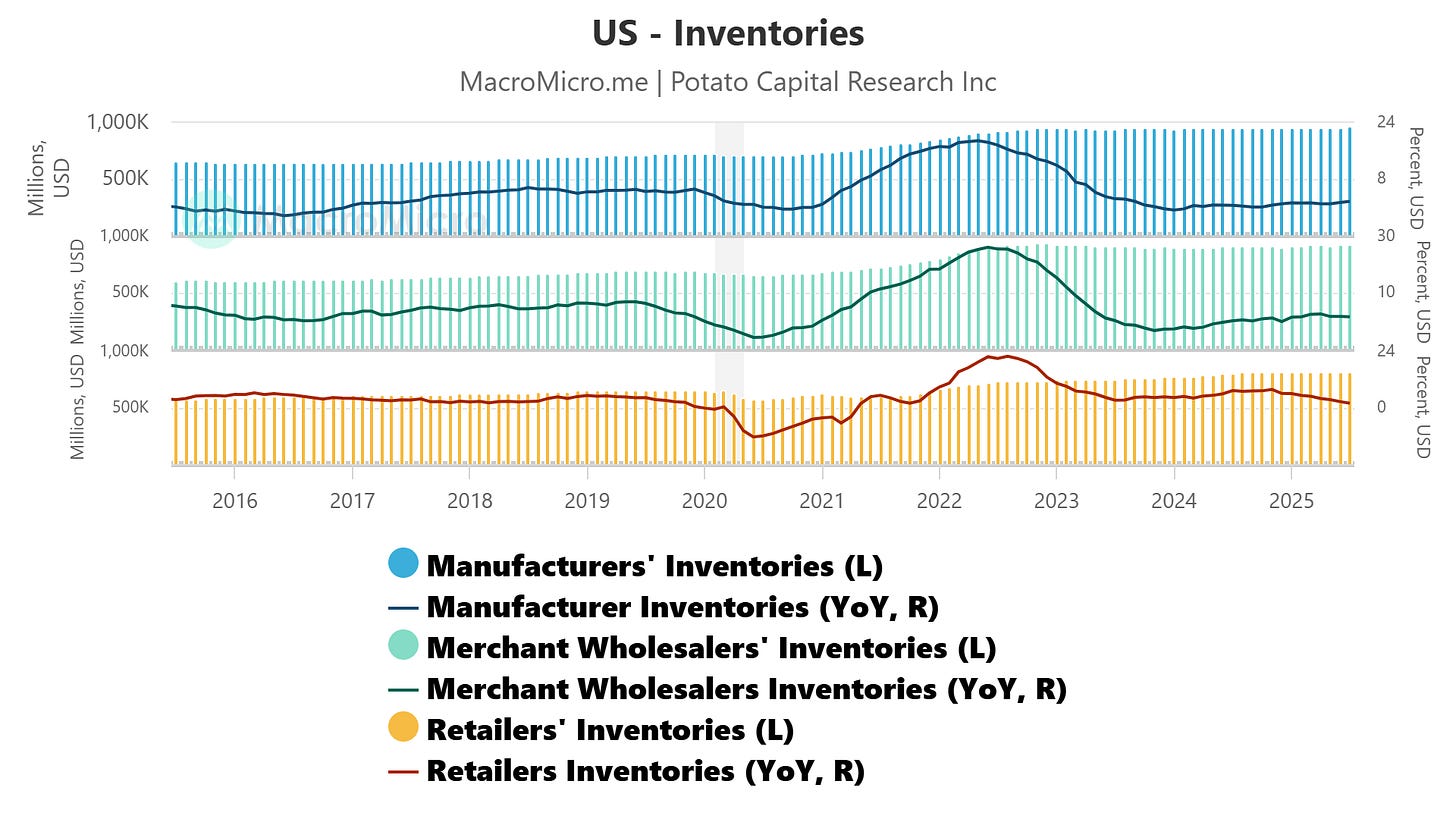
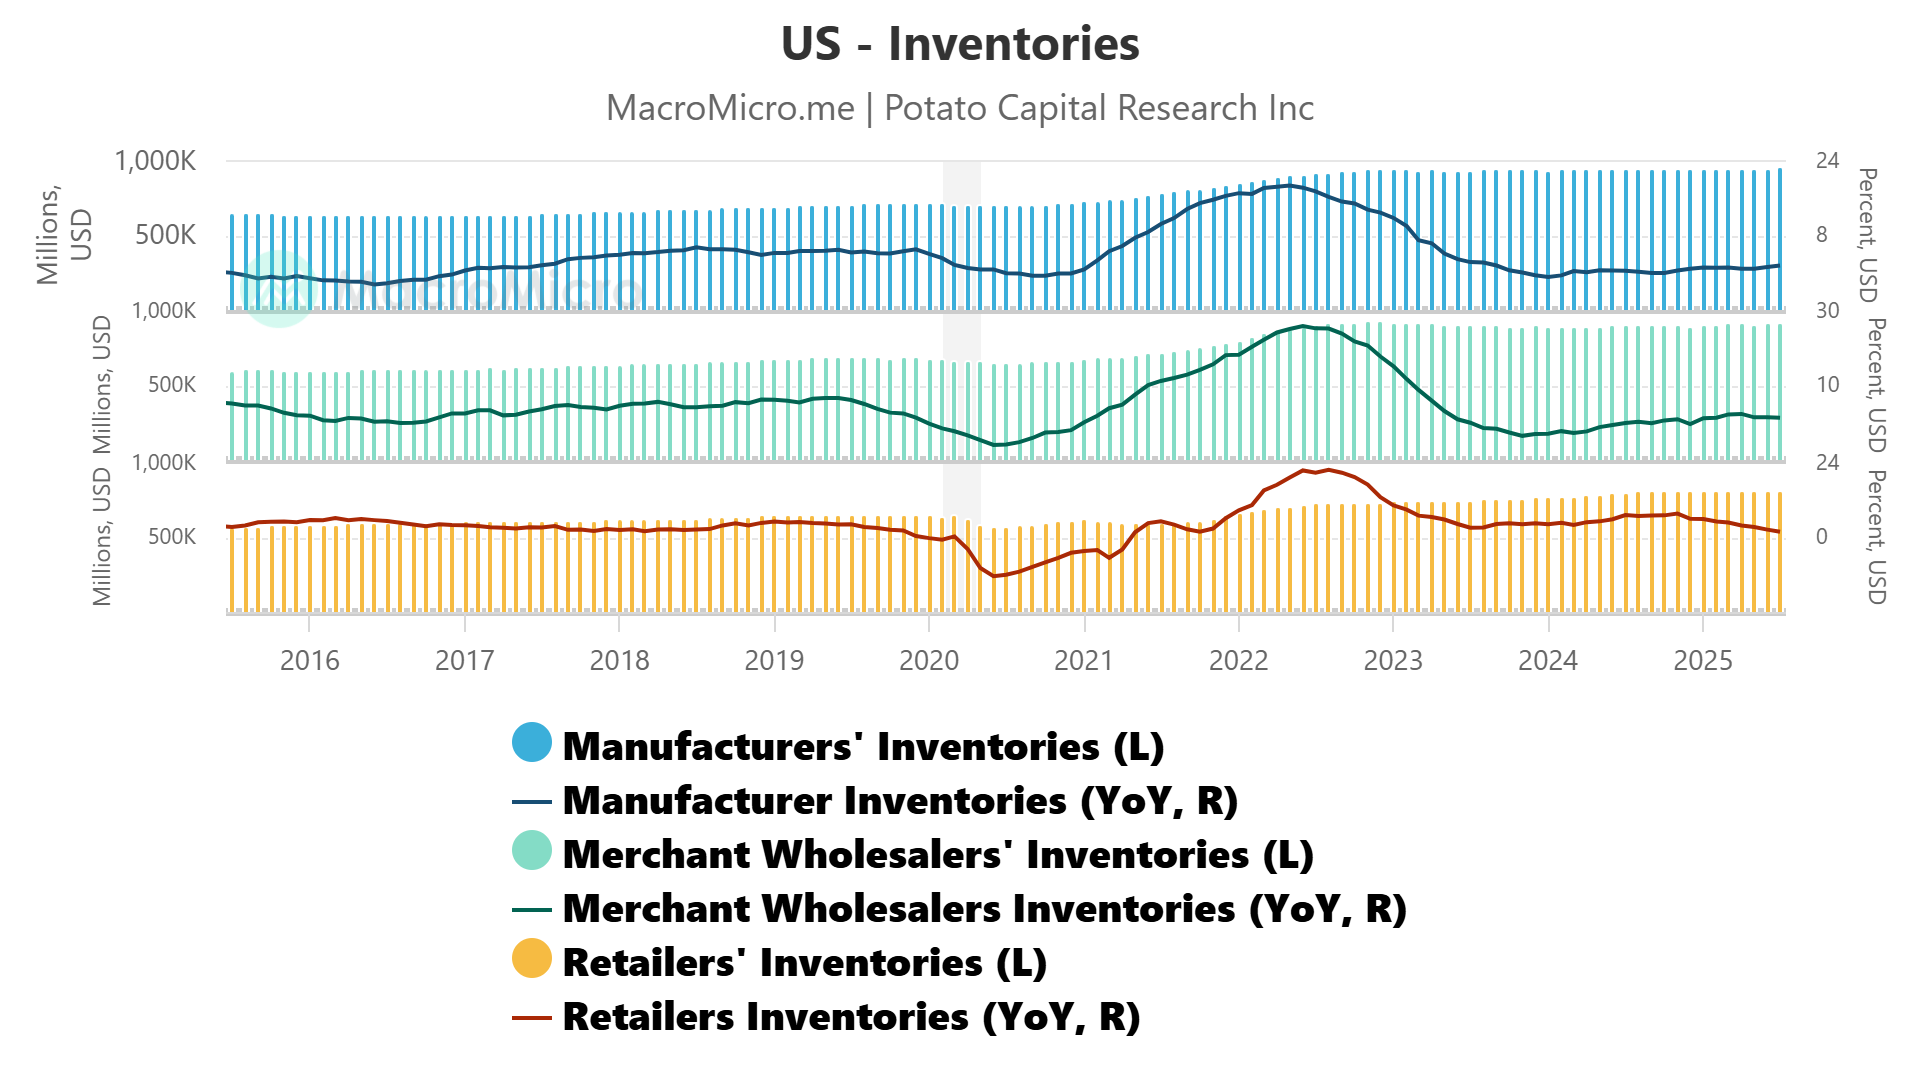
Headline GDP growth looks resilient on paper but softer in substance.
Nowcast models for the latest quarter show annualized real growth around 3–4%, yet the composition matters far more than the top line. Consumption remains the core engine of expansion, inventories have provided a temporary lift, public-sector spending continues to contribute meaningfully, and private fixed investment remains uneven across sectors.

Why We Stay Cautious
Inventories: Positive inventory swings are transient. They frequently precede a payback period as firms rebalance stocks to final demand. The recent contribution from inventories may exaggerate momentum and could subtract from growth over coming quarters.
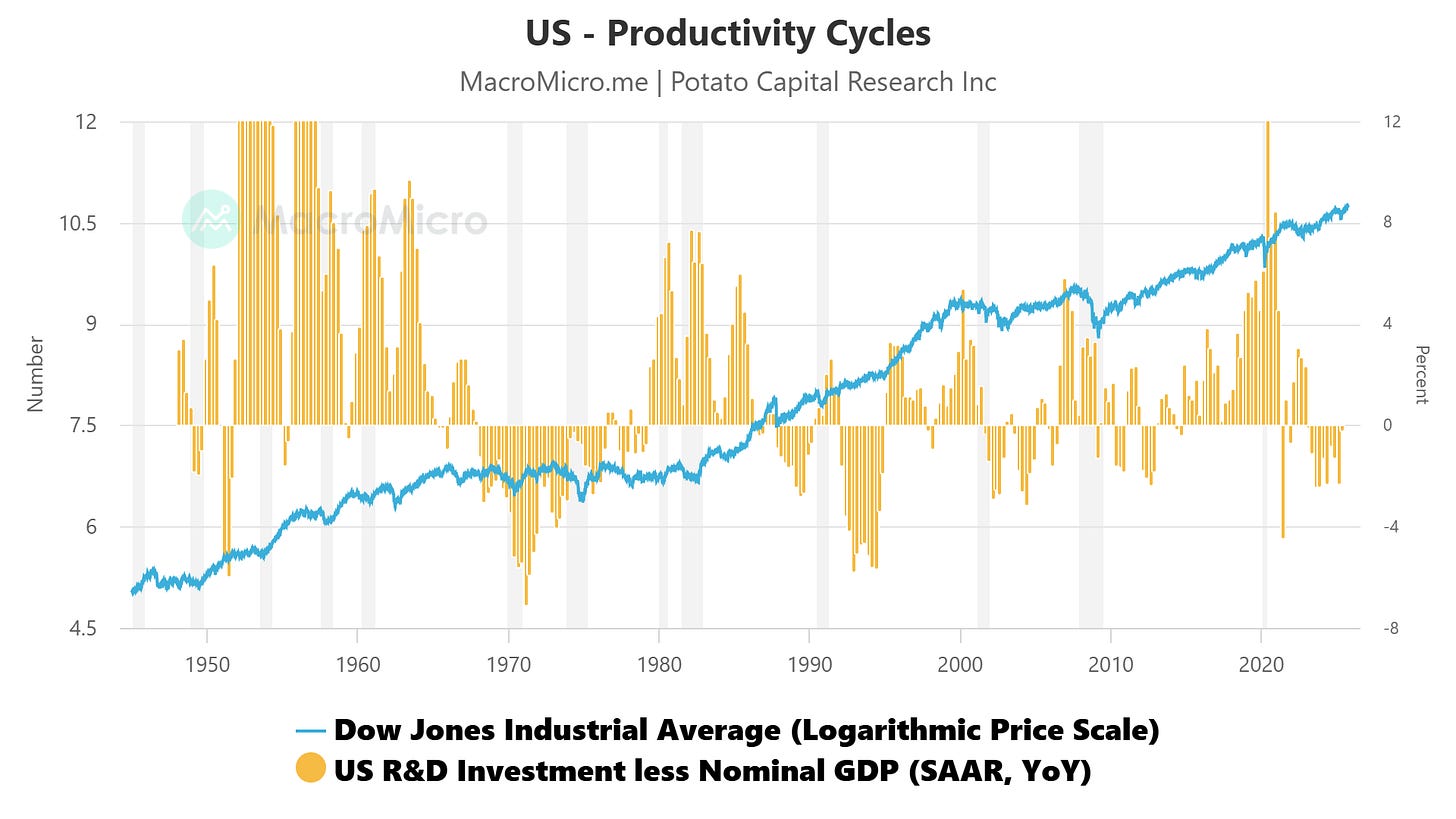
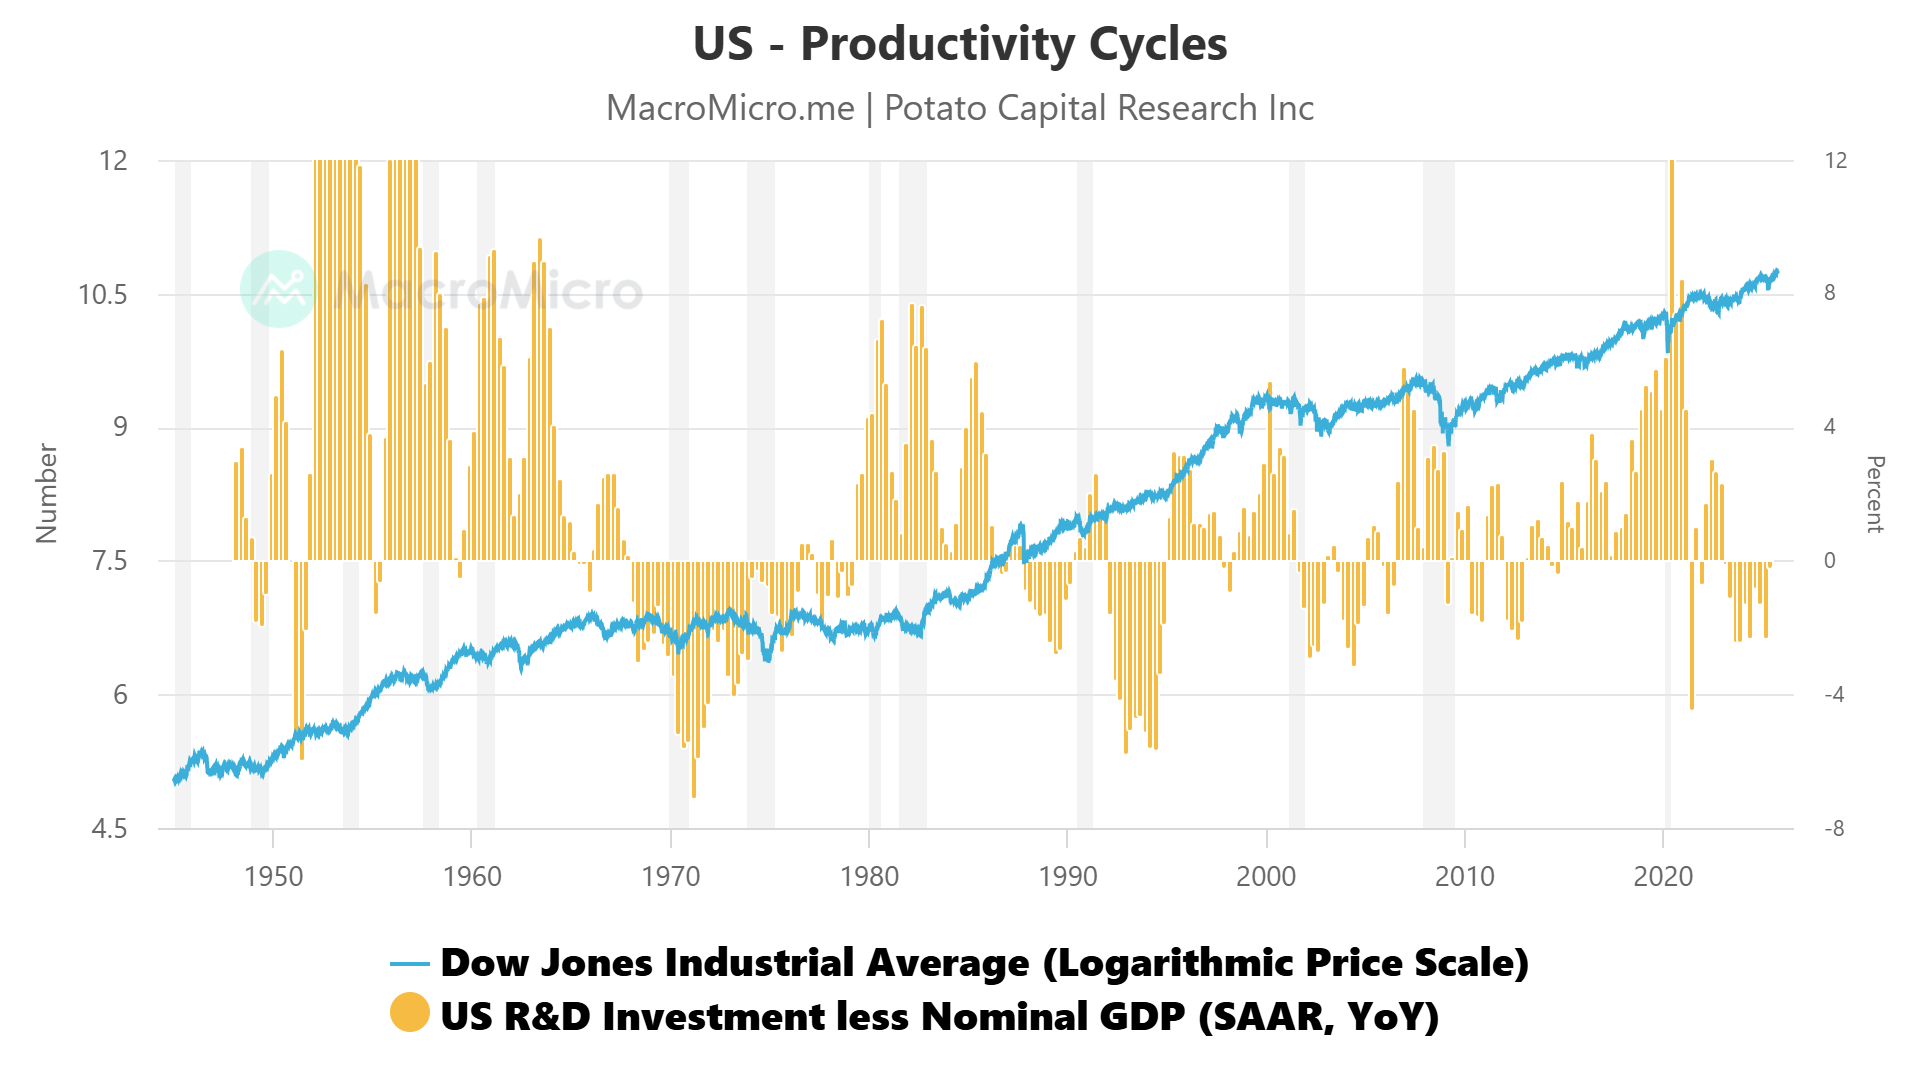
Productivity vs. hours: The apparent productivity improvement this year owes more to reduced labor hours than to structural efficiency gains. Output per hour can rise even when total-factor productivity stagnates - a reminder that the “AI-driven productivity boom” remains more expectation than measurable reality.
External growth: Weighted across major economies, global activity is mixed. The U.S. outperforms, Europe drifts near stall speed, and Asia oscillates with trade cycles and policy asymmetries.
This uneven distribution weakens the case for a synchronized global re-acceleration and reinforces the notion that U.S. growth resilience is partly statistical - supported by fiscal outlays and inventory accounting - rather than organic private-sector momentum.
Portfolio Implications
Cyclicals vs Compounders: Maintain tactical exposure to select cyclicals but emphasize secular compounders with sustainable returns on capital and durable pricing power. The growth mix rewards quality over leverage.
Small vs Large: A higher cost of capital still penalizes smaller, rate-sensitive balance sheets. Quality large-caps with stable funding structures remain better positioned; even with the curve slightly positive, funding differentials still favor scale.
Duration vs Equities: A balanced barbell of duration and defensive equities offers superior risk-adjusted performance versus an outright risk-on posture in an environment of moderate but uneven growth.
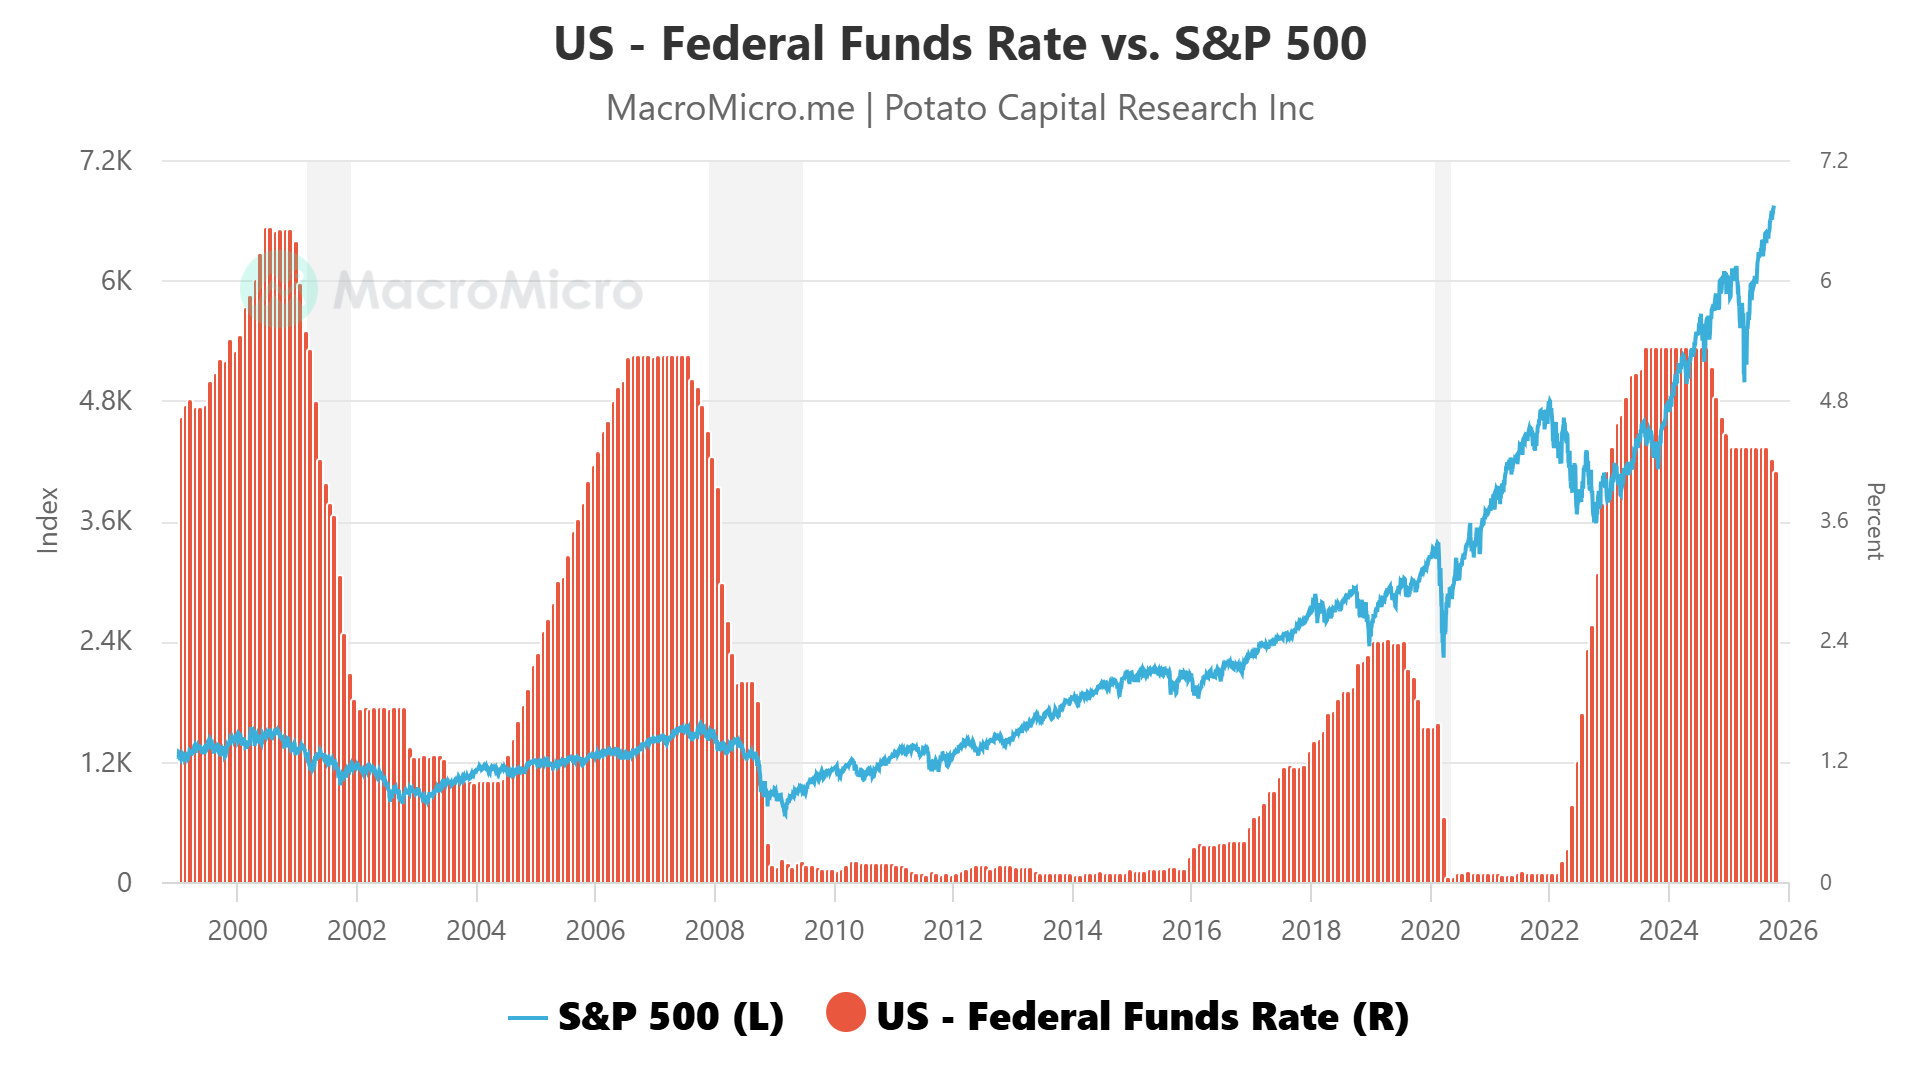
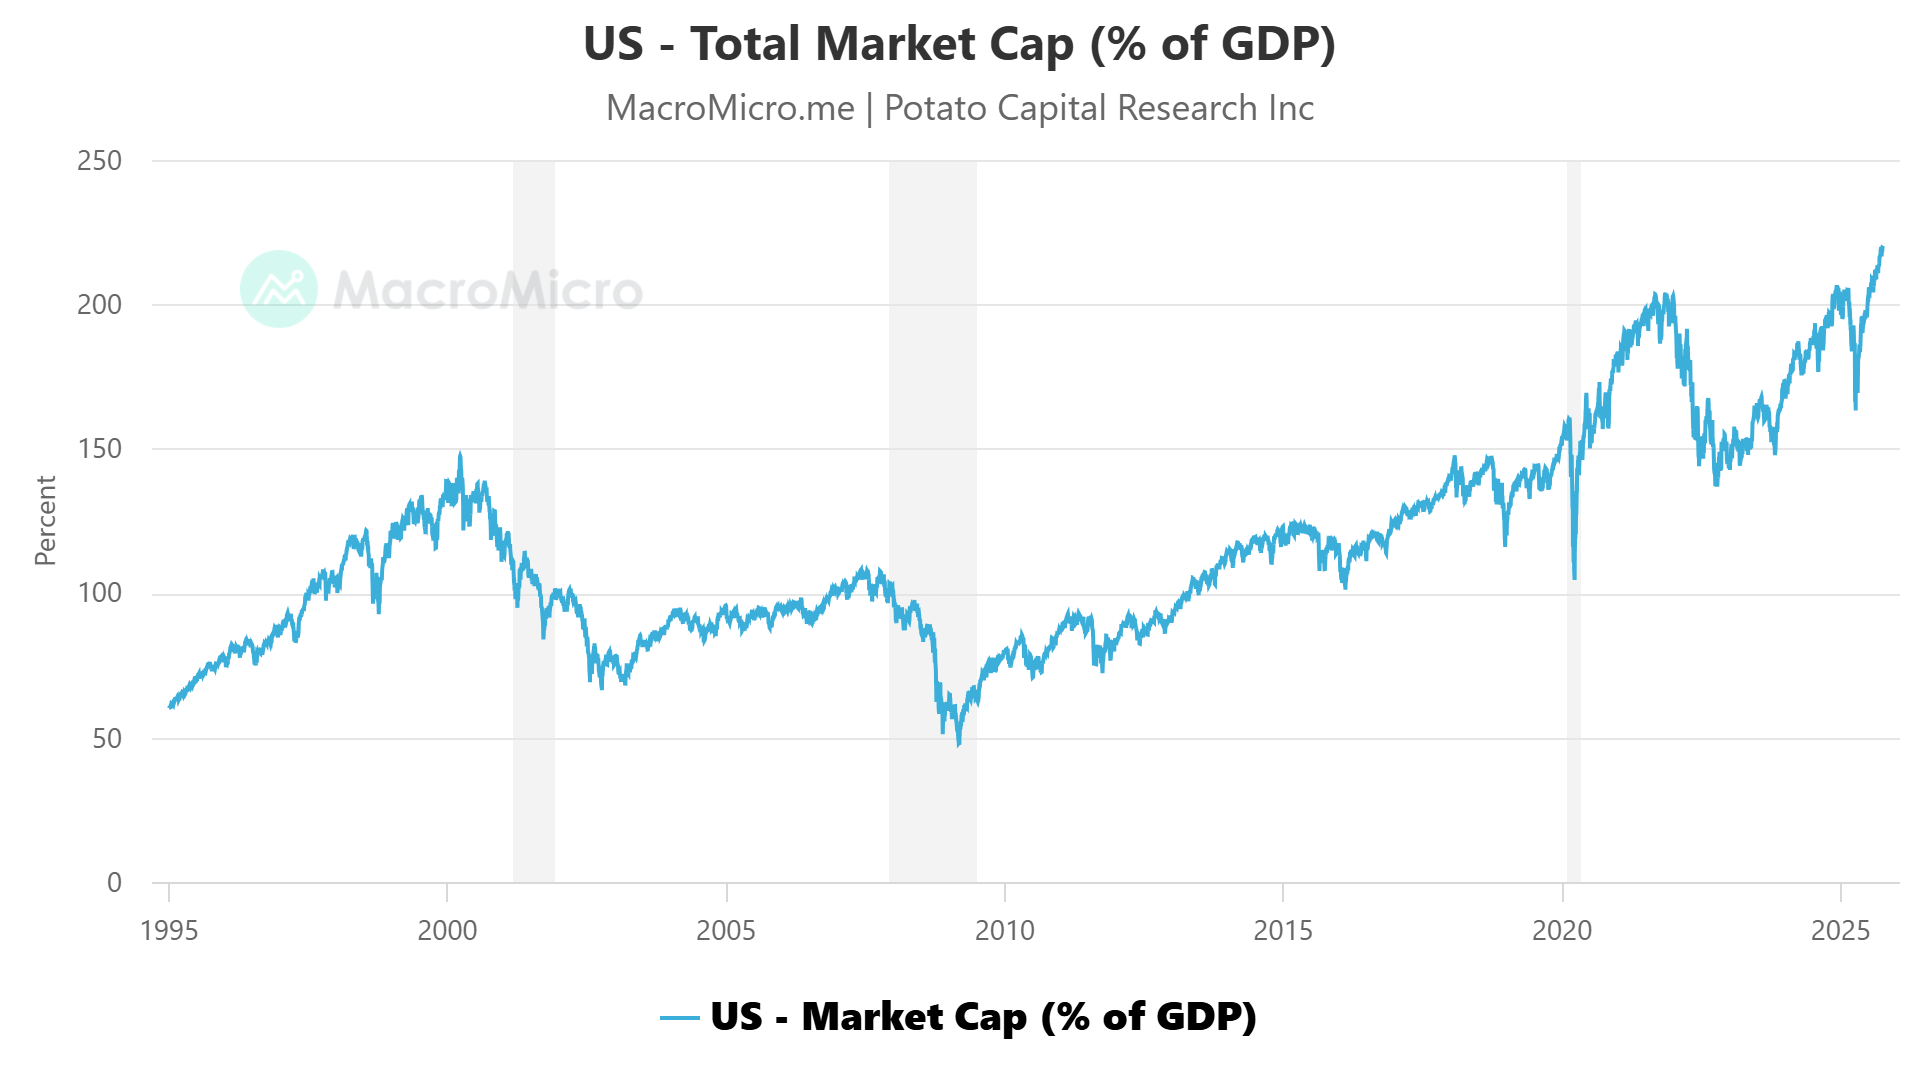
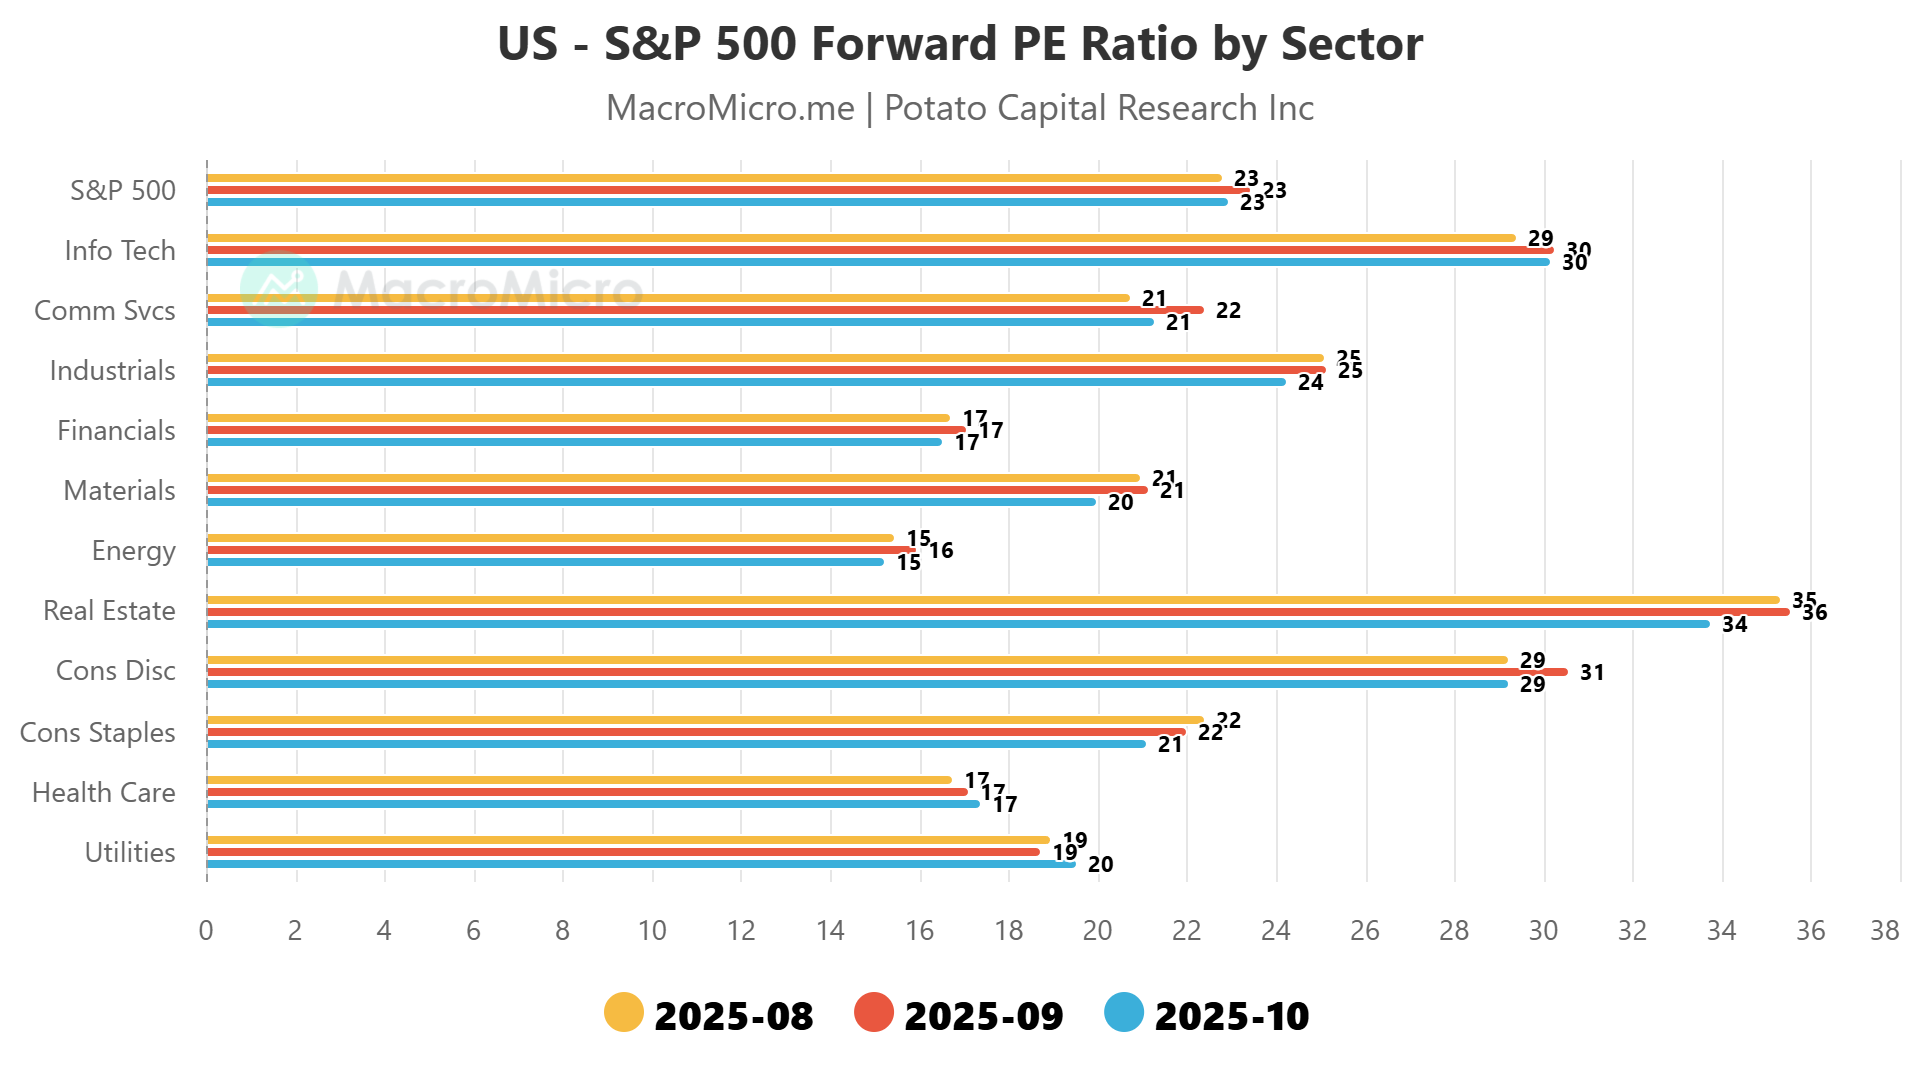
💰 Corporate Earnings & Valuation Anchors - Margins Meet the Cost of Capital
Equities have adjusted far less to higher real yields than bonds have, and that remains the central tension across risk markets. The S&P 500’s forward P/E still trades near the upper end of its ten-year range - roughly the 70th-80th percentile. While the equity-risk premium (ERP) stands near 3.8 percent as of October 2025, roughly 40 basis points below its year-ago level and the tightest since 2021. By the simpler earnings-yield-minus-Treasury measure, the ERP is barely 0.3 percent - illustrating how rich equity valuations have become even as the model-based premium remains higher.
In other words, investors are being paid less to own equities at the very moment when the cost of capital has normalized upward.
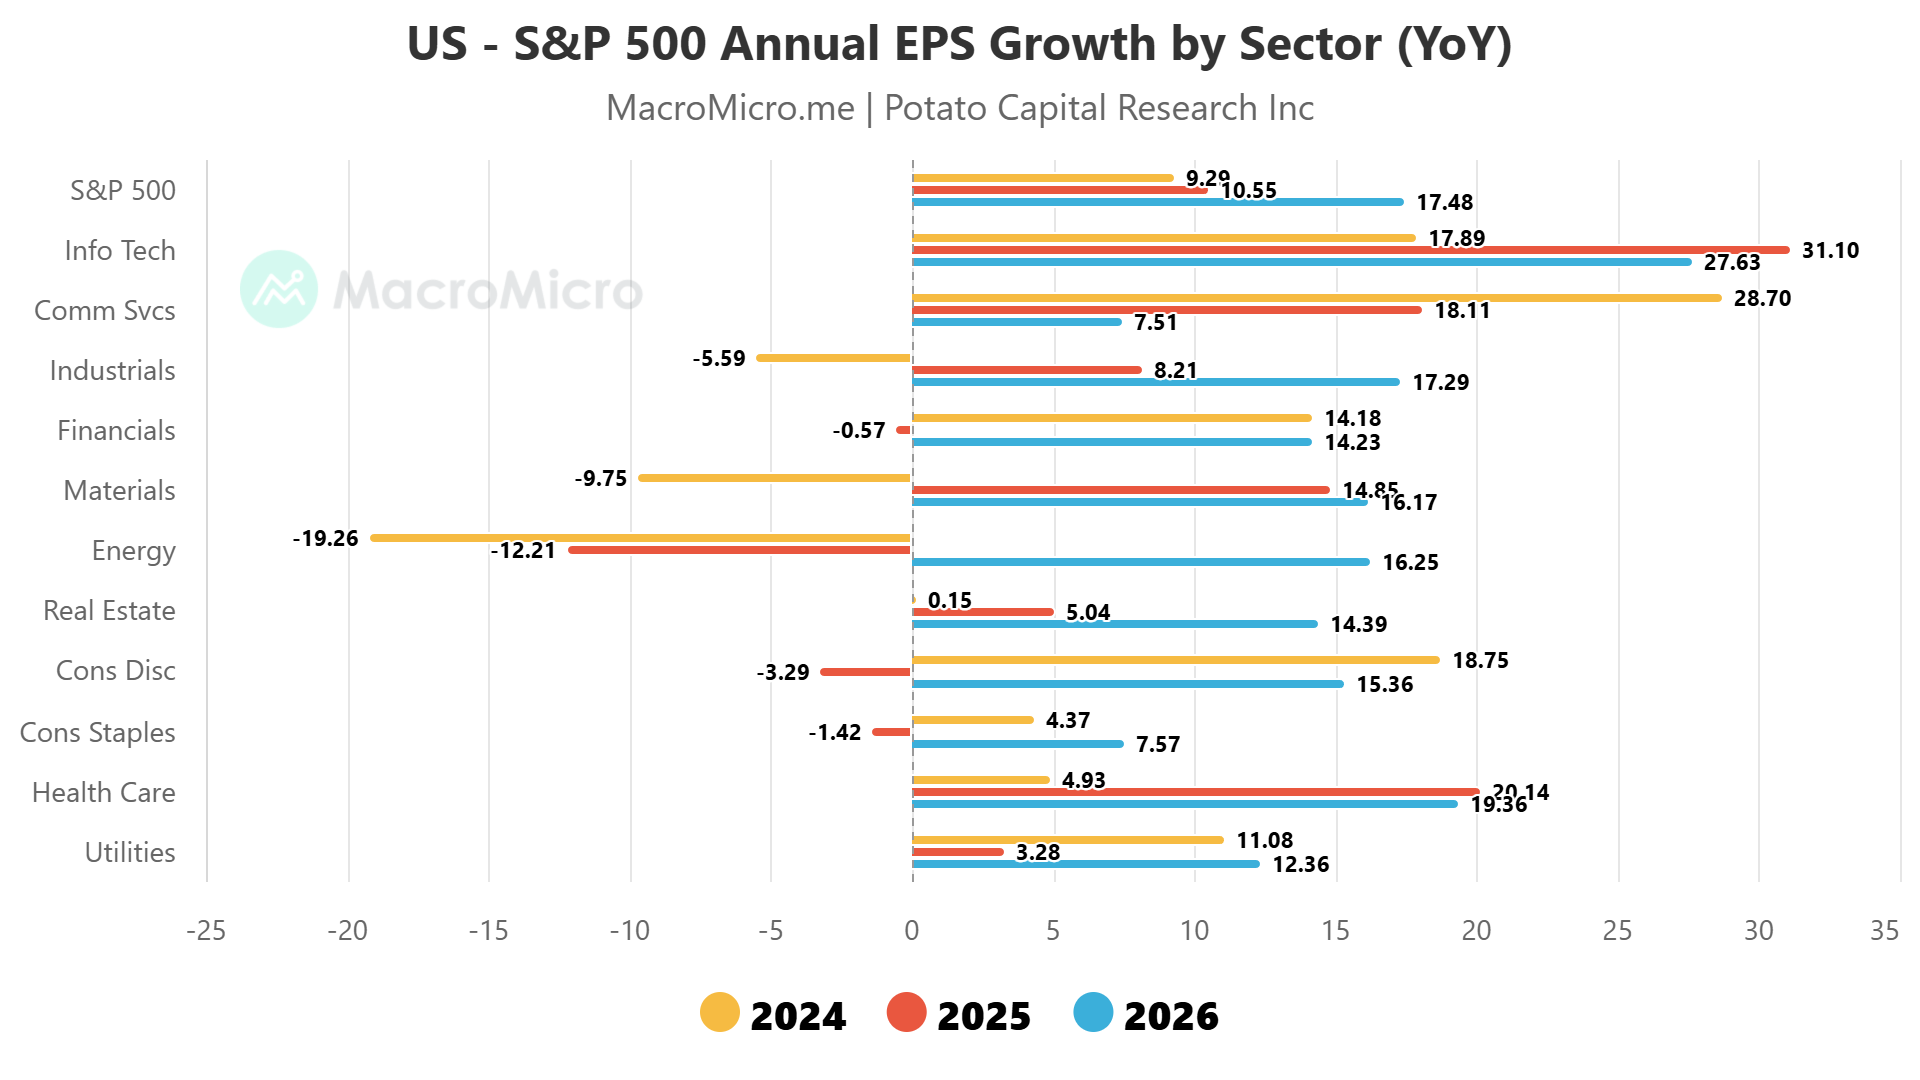
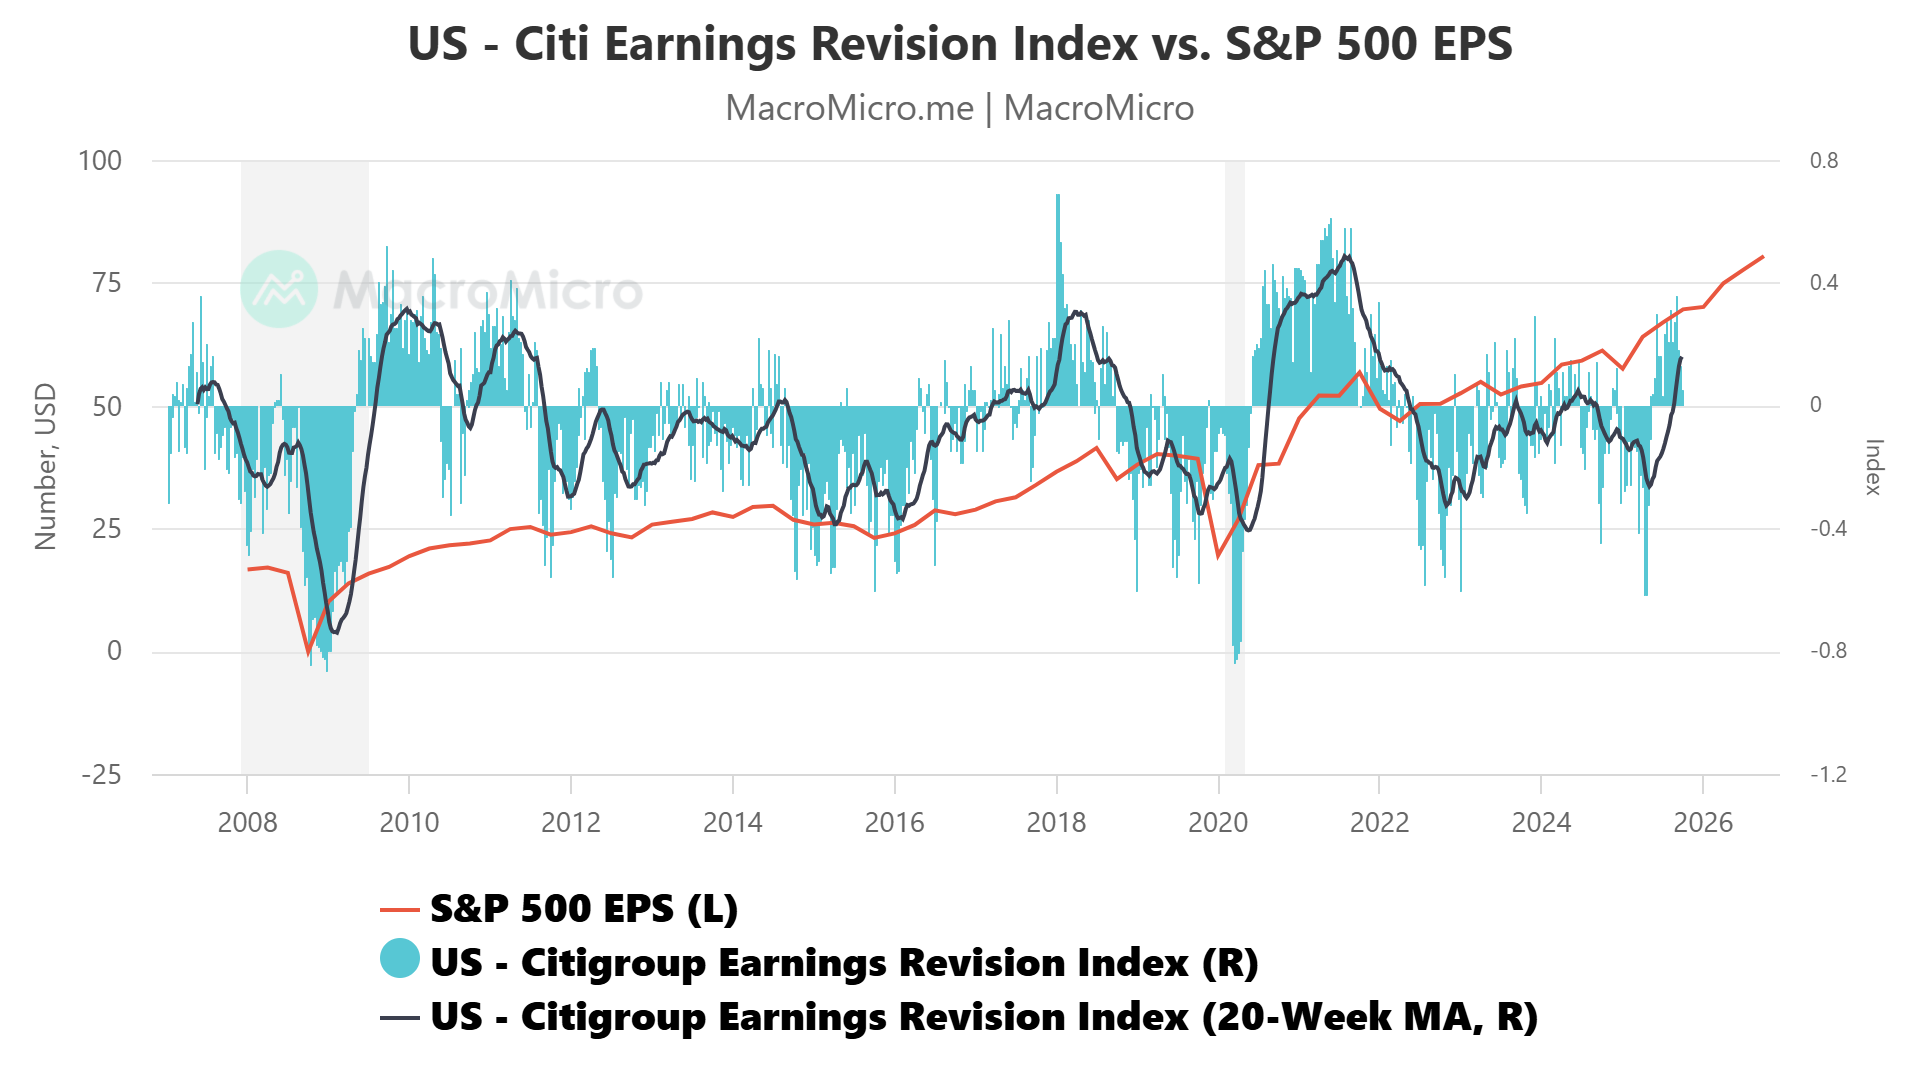
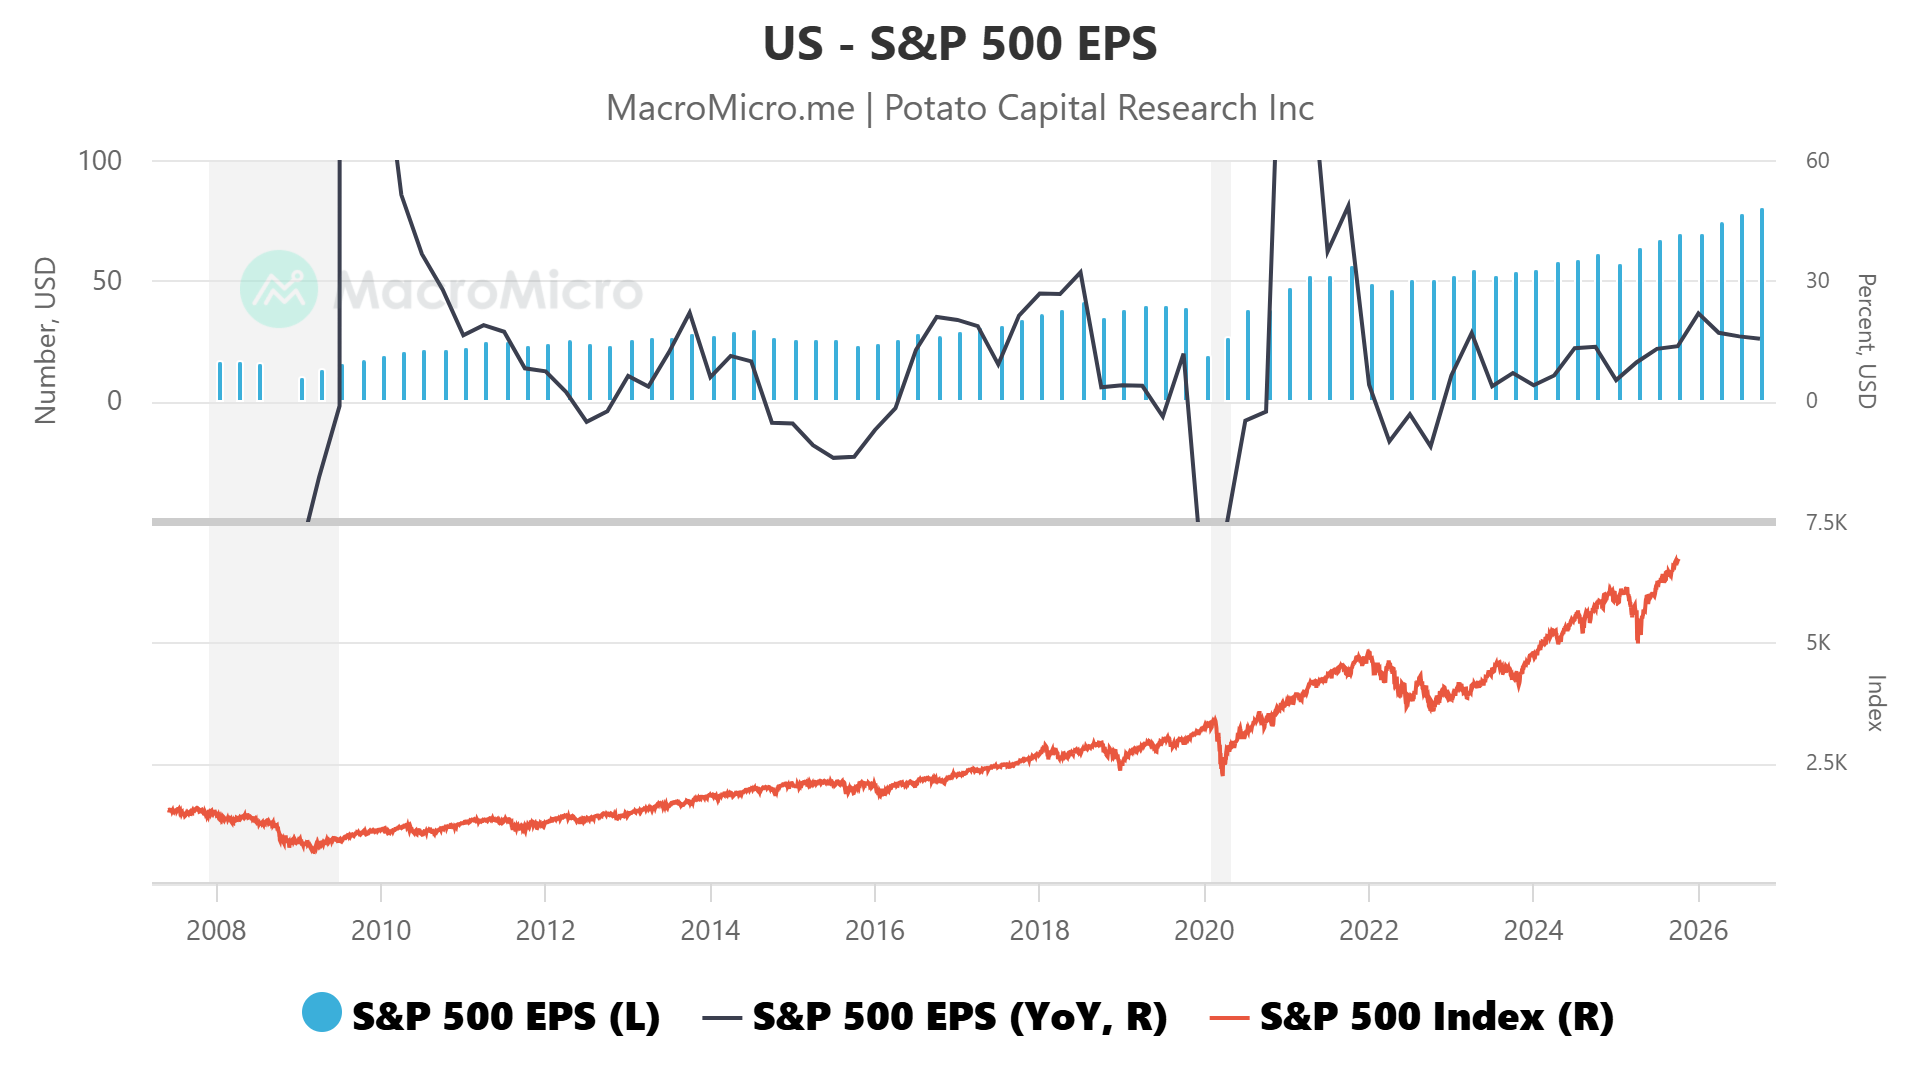
That strain is visible in earnings revisions and the composition of growth.
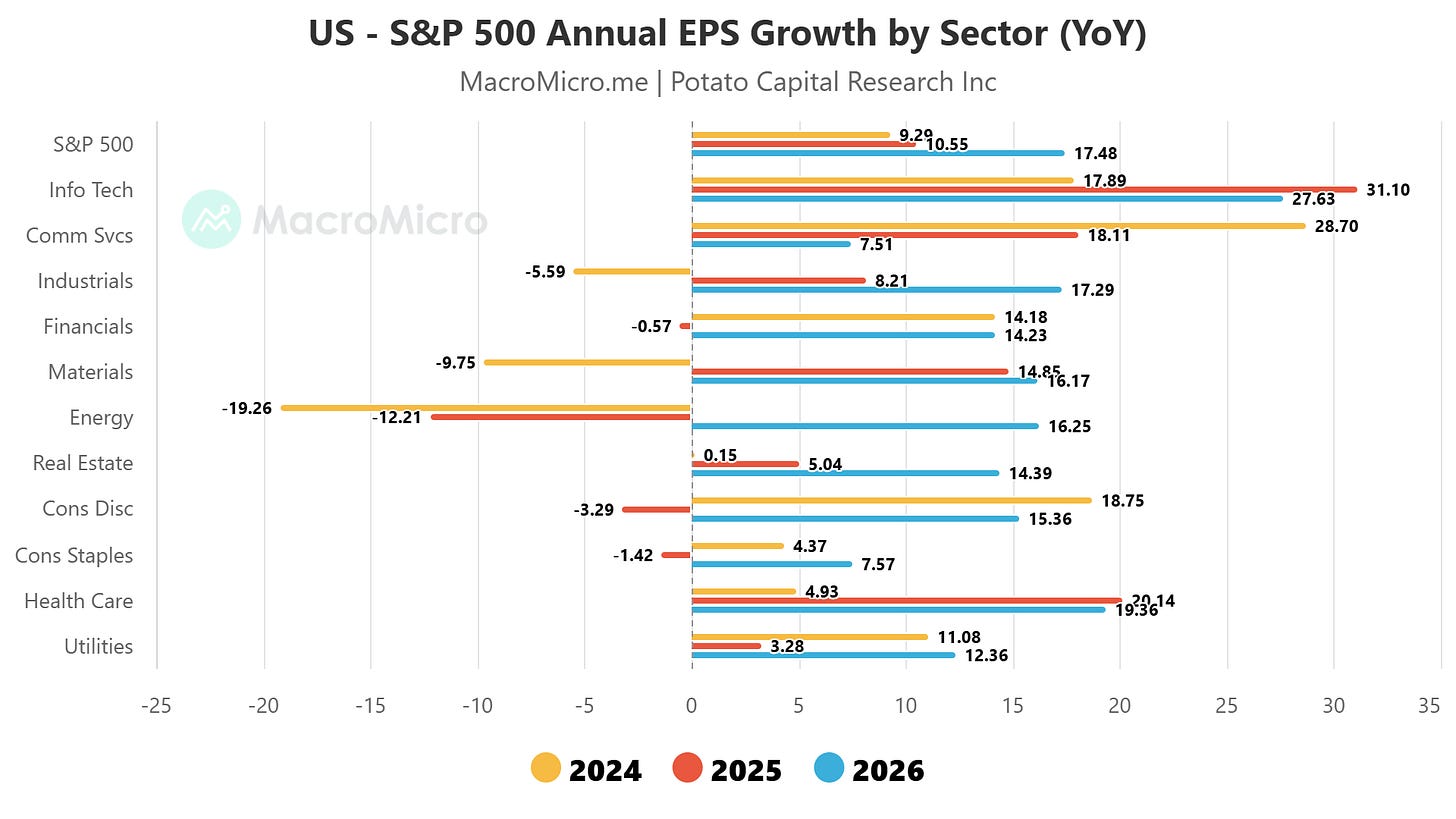
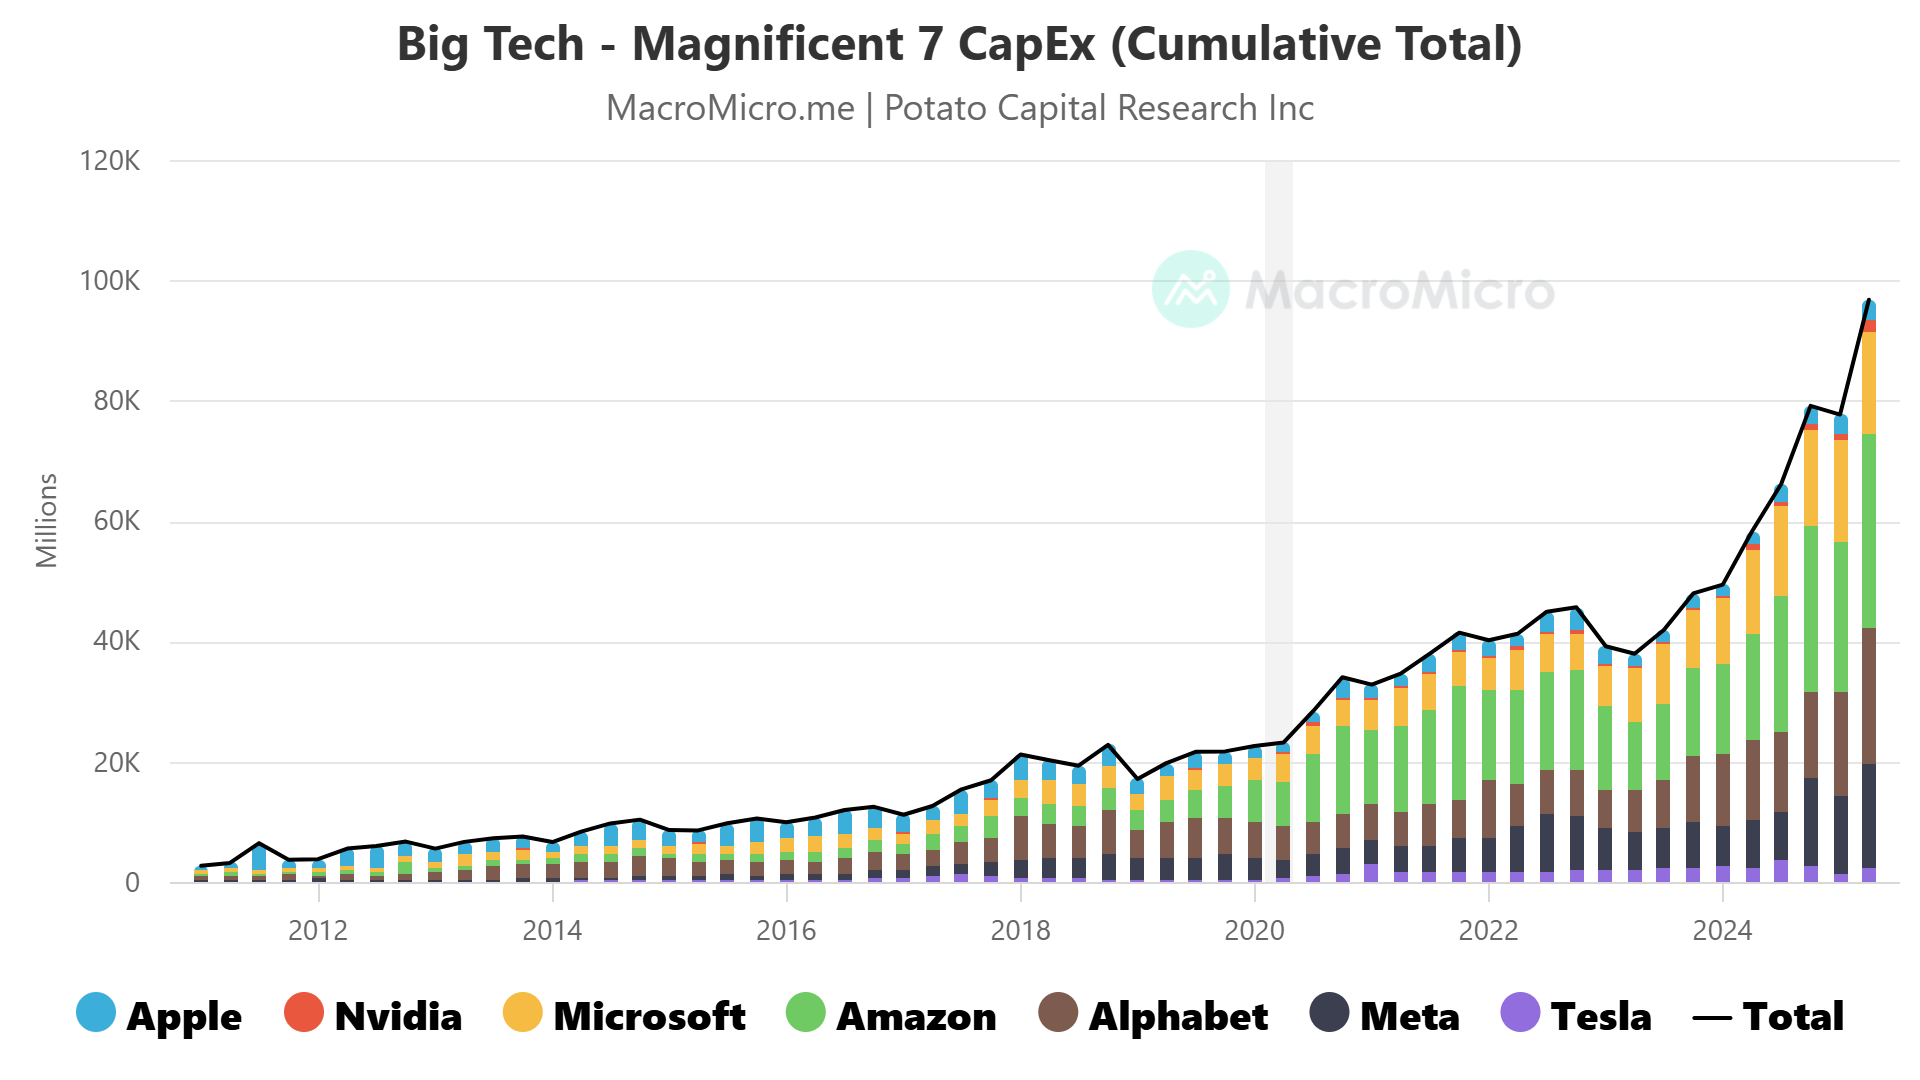
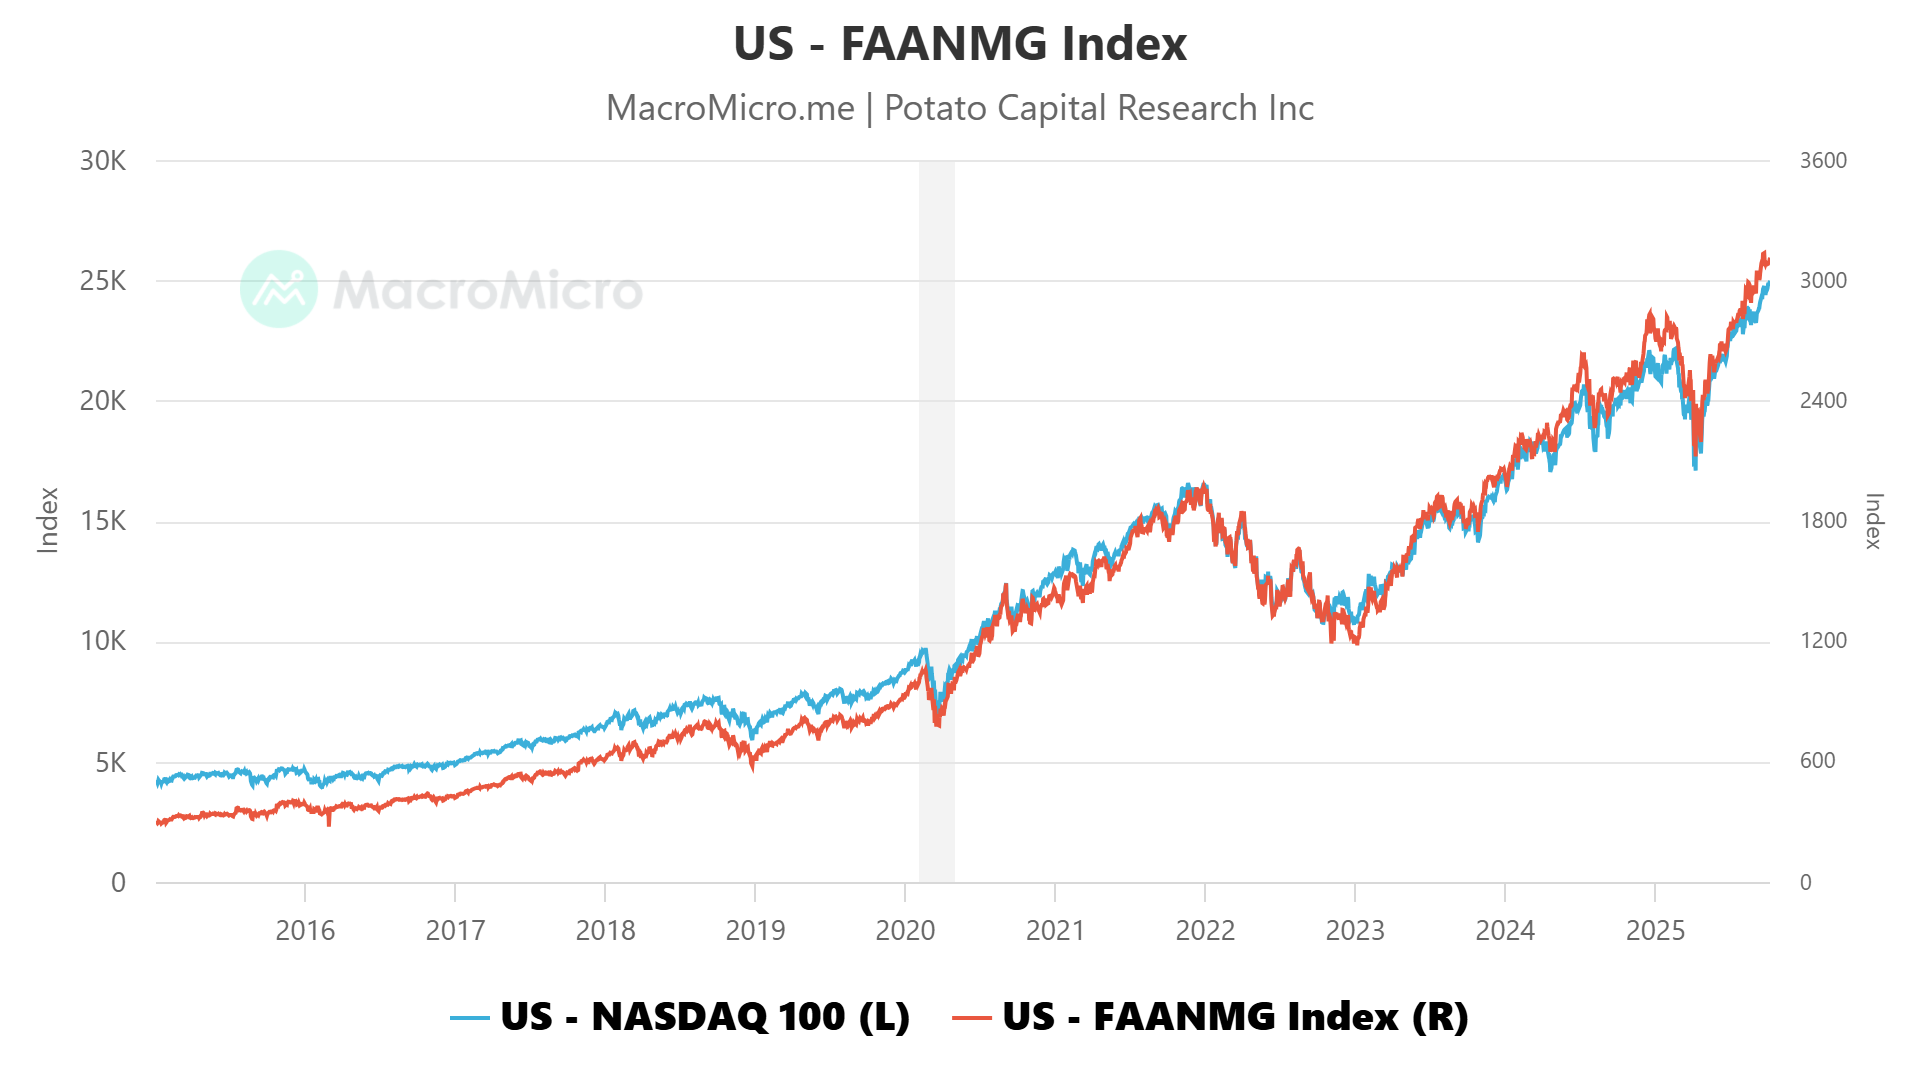
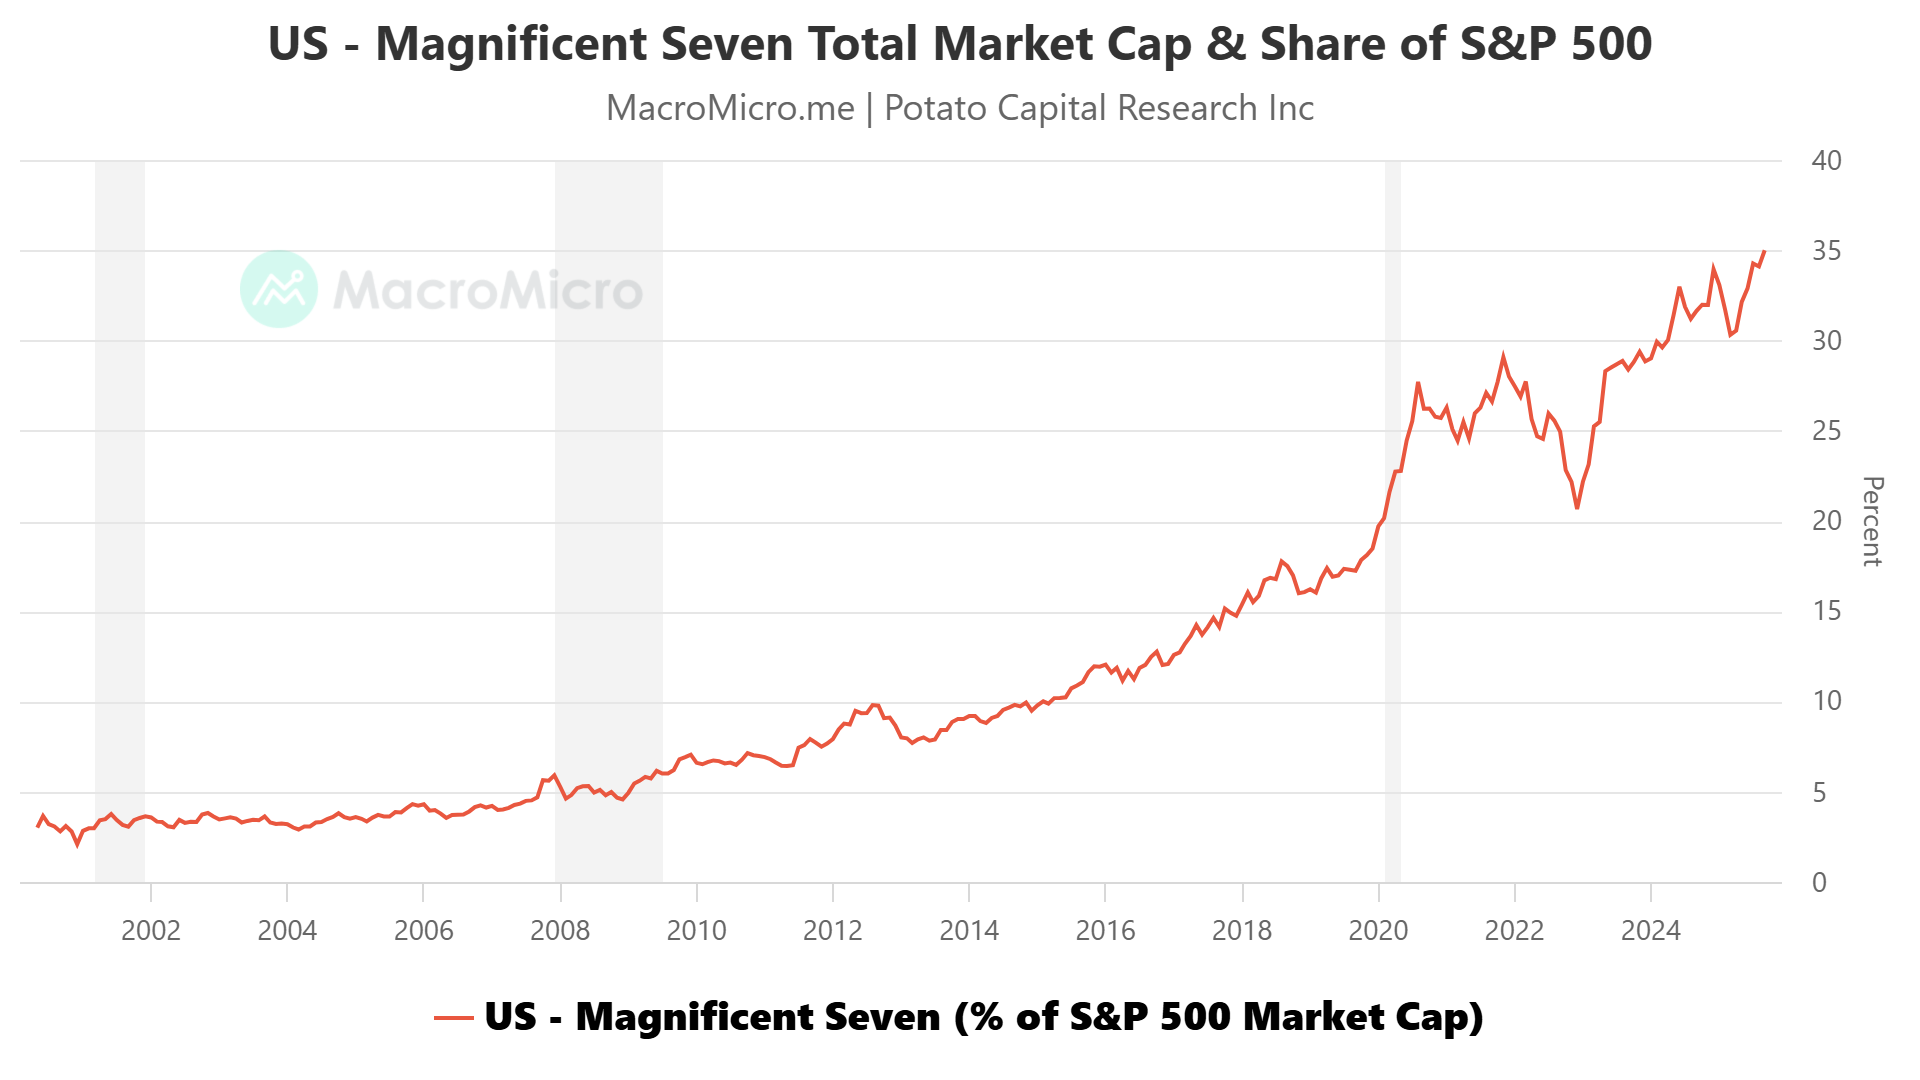
Consensus EPS expectations for 2025 have flattened, and roughly 90% (FactSet) of positive revisions are concentrated within the Mag 7 cohort.
Outside that narrow group, sector breadth is weak - excluding Technology, median EPS growth is only marginally positive.

Valuation anchors are now dictated by real yields. Empirically, every 50 bps rise in the 10-year TIPS yield trims roughly 1½ points from fair-value P/E multiples, all else equal. Until real yields roll over decisively, any multiple expansion must come from a reacceleration in forward earnings - and current data do not support that outcome.
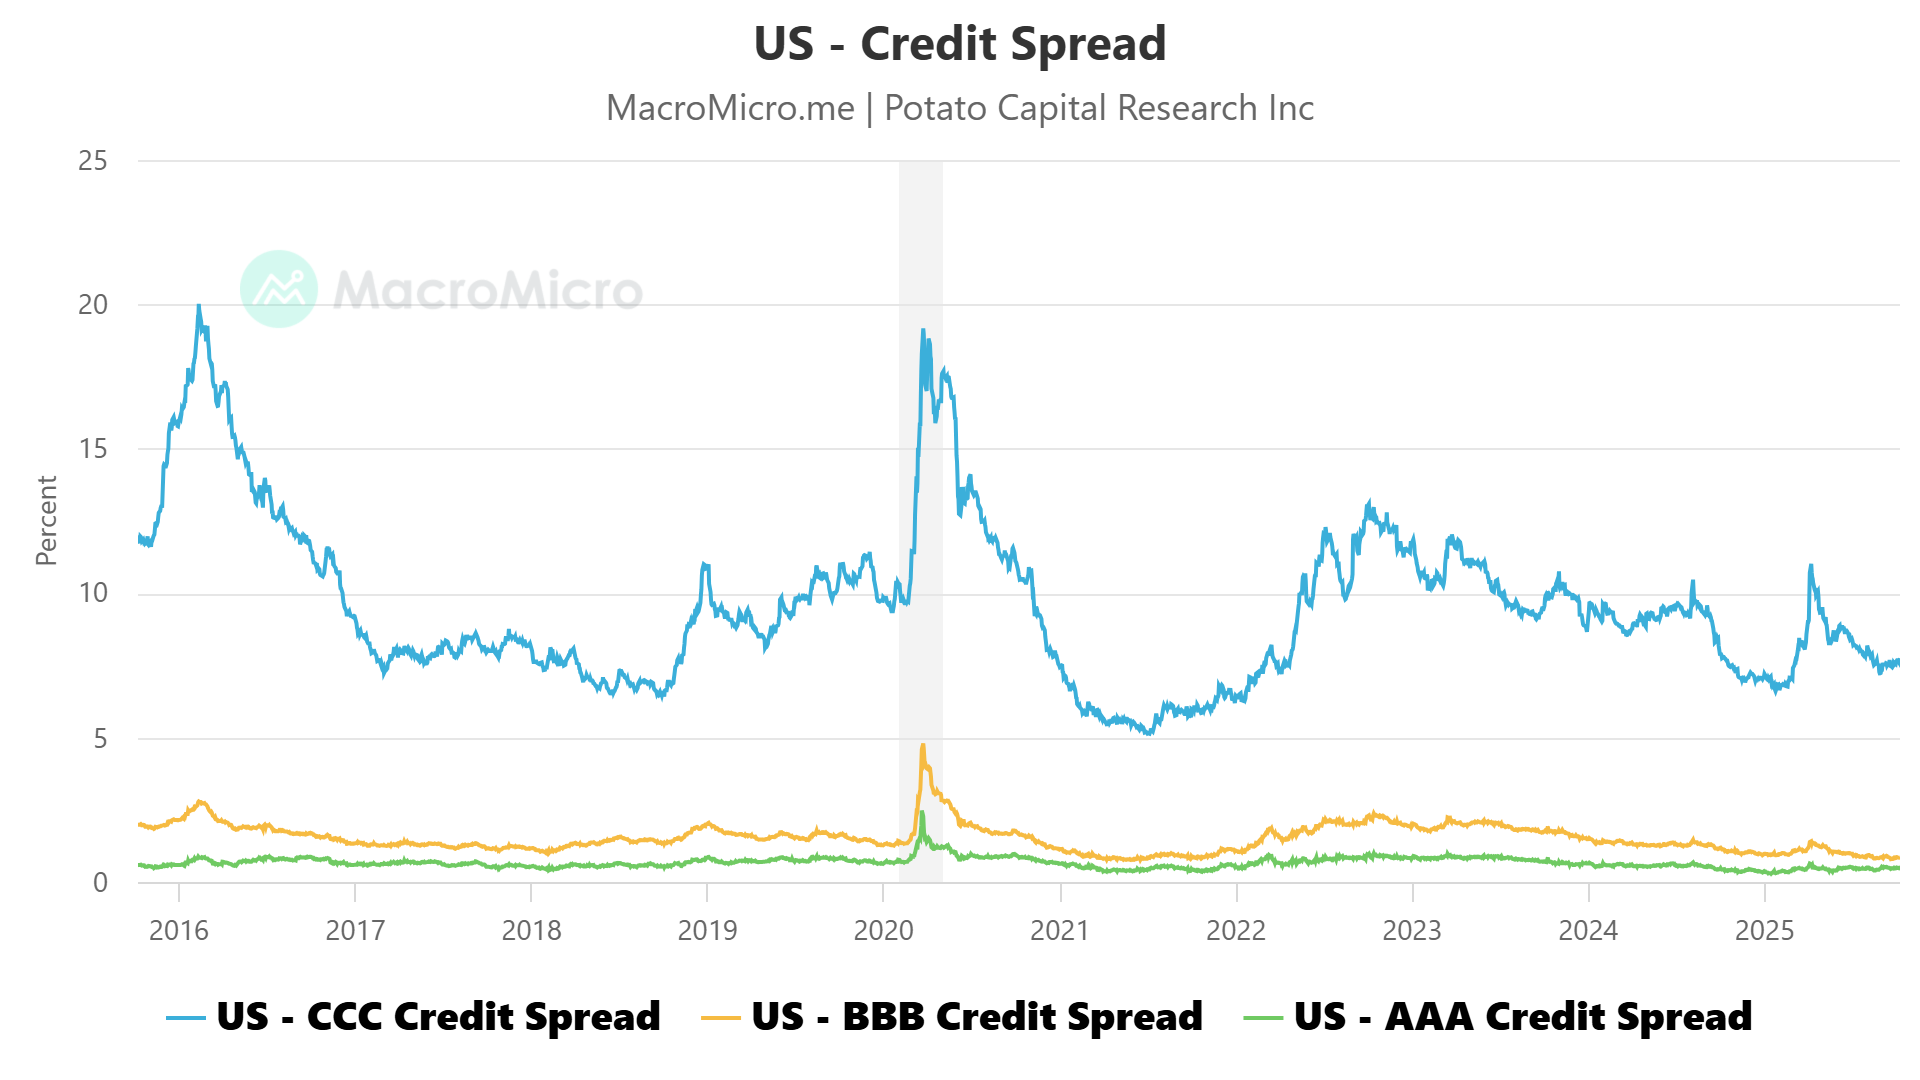
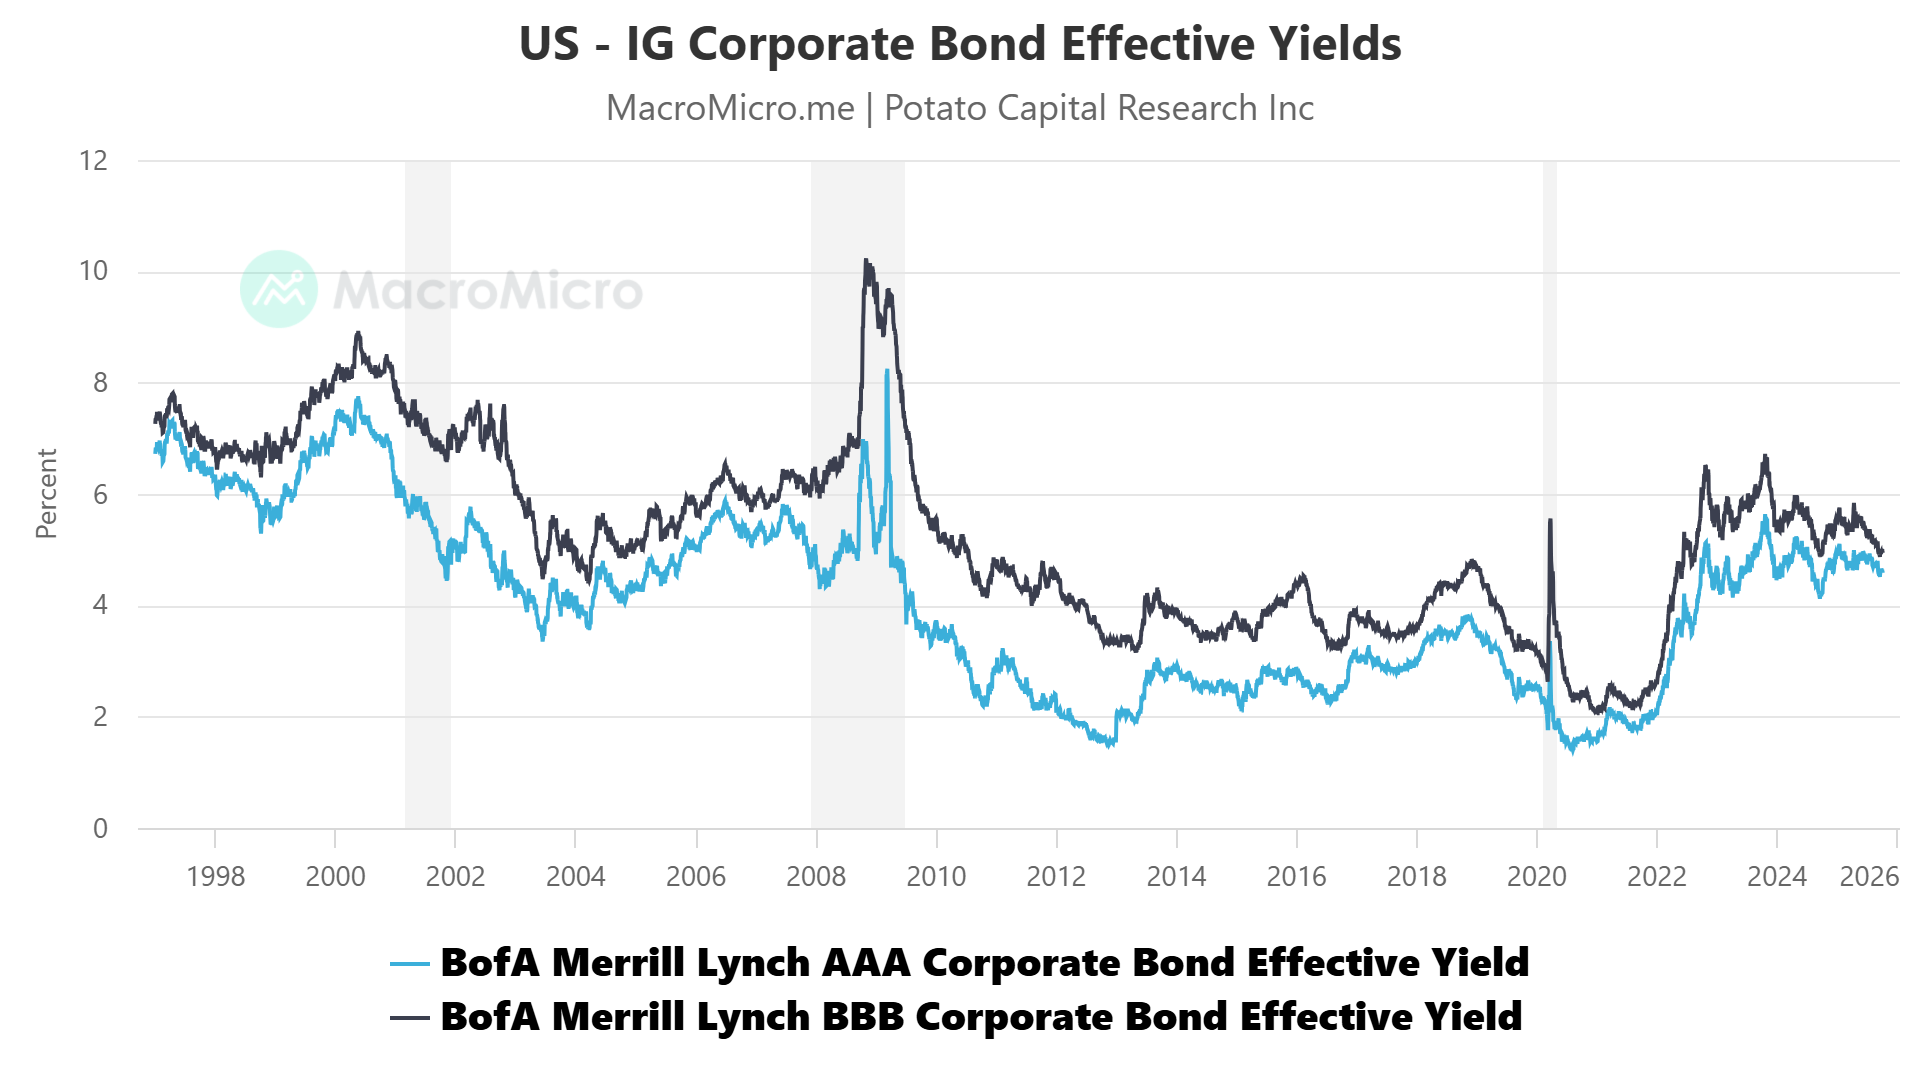
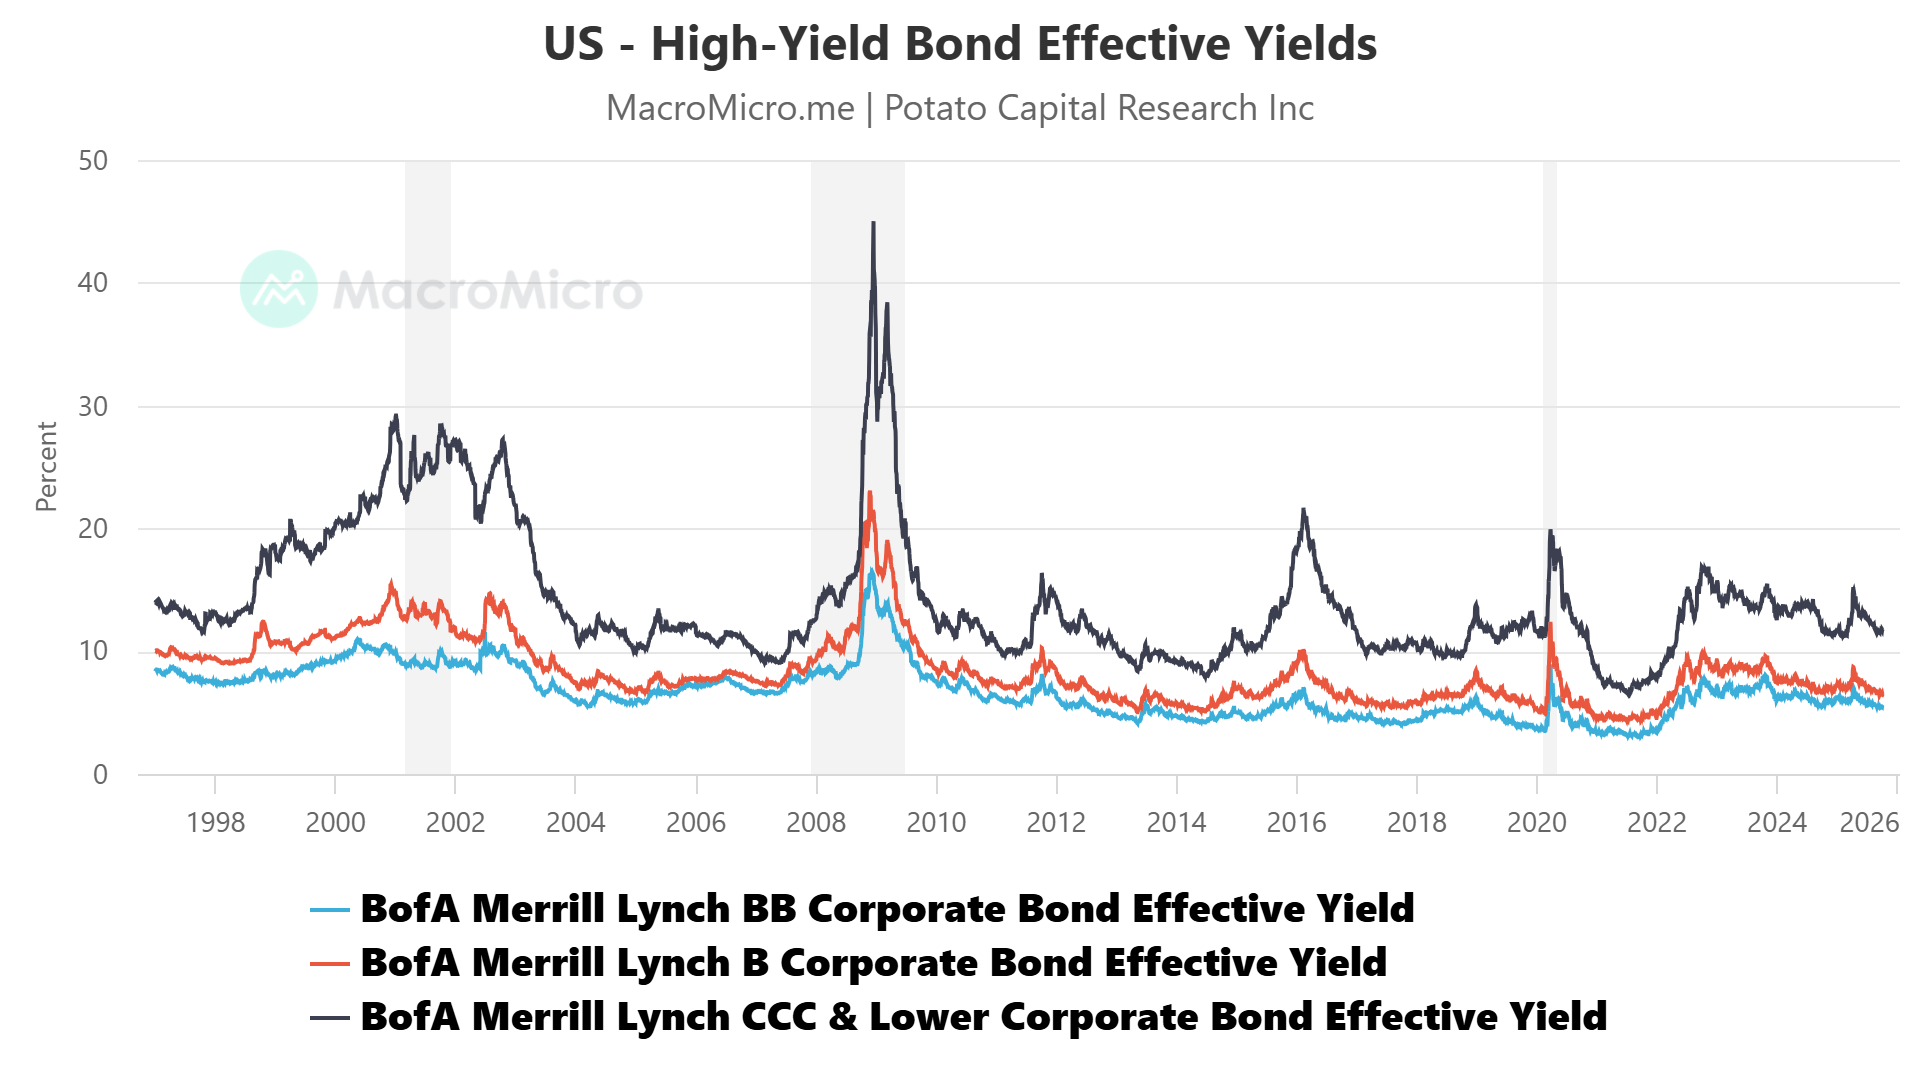
Credit markets echo the same message. Investment-grade spreads remain pinned near post-pandemic tights, while high-yield spreads have compressed below 300 basis points - levels that offer little cushion against refinancing risk.
The refinancing wall for sub-investment-grade issuers steepens sharply in 2026-2027, and funding at 9-10% coupons will squeeze margins.
This is how higher real yields translate into corporate discipline: every refinancing round enforces greater capital efficiency and rewards balance-sheet prudence.

Positioning Implications
Credit: Overweight investment-grade carry - spreads still compensate well for risk, unlike high yield, where asymmetry is poor heading into the 2026-27 maturity wall.
Equities: Stay neutral on mega-cap technology for balance-sheet strength, but underweight leveraged cyclicals reliant on cheap refinancing.
Portfolio tilt: Favor quality and capital efficiency over broad beta. Treat any multiple expansion as capped until real yields begin a sustained decline.
⚙️ Manufacturing, Services & Labor - Soft Demand, Hard Floors
Keep reading with a 7-day free trial
Subscribe to Potato Capital Research to keep reading this post and get 7 days of free access to the full post archives.