

💣 July's Trapdoor, August's Opportunity - Potato Capital Monthly Newsletter August 2025
Why volatility is waking up, liquidity just flipped short-term, and earnings season broke the narrative
🔑 Executive Summary
July closed at euphoric highs - but beneath the surface, the regime was already cracking.
The S&P 500 made new records, yet liquidity was deteriorating, inflation was mutating, and positioning was historically stretched. The first days of August simply exposed the fragility already embedded in the system: volatility surged, cross-asset correlations snapped, and leadership fractured across tech, cyclicals, and high-beta names.
This wasn’t a surprise.
It was a delayed inevitability.
Now, August presents one of the most asymmetric macro setups since late 2022 - a rare intersection of structural fragility, policy inflection, and statistical seasonality.
🧨 What’s Changed:
Liquidity is thinning quietly: Treasury cash drains, BOJ yield normalization, and a stalled RRP unwind are removing support just as internals weaken.
Political inflation is distorting the signal: Headline CPI is softening, but core trends in healthcare, housing, and services remain sticky - and the bond market is reacting.
The volatility regime has flipped: VIX term structure is now inverted; correlation breakdowns suggest dealers are no longer absorbing risk.
Earnings are splitting leaders from laggards: Dispersion is widening across mega-cap tech, retail, and industrials - and guidance drift is hitting hard.
The Fed is on pause, not autopilot: After the latest jobs report, rate cut odds for September surged from ~30% to over 80%, triggering a violent repricing across rates and tech.
Statistically, August is the second-worst month for equities, trailing only September in average and median drawdowns.
But this year, the risk isn't just seasonal - it’s structural.
Welcome to the August Liquidity Crunch - where macro, math, and market structure are finally aligned. And that’s where we thrive.
🌊 Liquidity Conditions
July’s rally masked a slow-motion liquidity squeeze that is now becoming undeniable in August.
Here’s what changed - and why it matters now:
🔻 Net Liquidity Is Falling Again
Reverse Repo (RRP) drain has stalled - the $100B/week drawdown from Q2 has slowed to < $10B/week. That tailwind is exhausted.
The Treasury General Account (TGA) is rebuilding - increased bill issuance is draining reserves from the banking system.
Quantitative Tightening (QT) remains on autopilot - the Fed continues to allow $95B/month to roll off its balance sheet.
💡 Net liquidity = Reserves – TGA – RRP
That equation is now pointing lower for the first time since Q1.
BOJ: The Quiet Global Shift
In July, the Bank of Japan effectively ended strict Yield Curve Control (YCC) - allowing long yields to rise above the 1% cap.
As Japanese bond yields rise, capital is being repatriated - reducing outbound flows into U.S. Treasuries and global risk assets.
This weakens a key liquidity transmission channel that supported markets in Q1 and Q2.
Japan was the stealth liquidity engine. That chapter is over.
🏦 Credit Isn’t Panicking - Yet
High-yield spreads remain tight - but that’s backward-looking.
Leveraged loan issuance is slowing.
Bank lending standards tightened again in the latest Fed SLOOS.
Private credit (shadow lending) is still flowing, but early signs of stress are visible in:
Small-cap financing gaps
Consumer delinquencies (autos, subprime cards)
🥔 Our Take:
Liquidity isn’t collapsing - yet.
But the marginal flow has flipped from tailwind to headwind. With positioning still extended and volatility rising, this is a dangerous backdrop for passive exposure.
This is where structural stress begins - not with a crash, but with thinning oxygen for risk assets.
🌀 Volatility & Correlation Regime
The market has entered a new volatility regime - one marked by elevated realized volatility, decaying dispersion, and a full inversion of the VIX term structure.
Here’s the breakdown:
📈 VIX Term Structure: Inversion Confirmed
The VIX curve flipped inverted in early August - a classic signal of hedging demand and regime change.
1M VIX futures now trade above 3M and 6M - a signal last seen in the March 2023 bank panic and August 2022 inflation spike.
Inverted volatility curves don’t predict crashes - they price fragility.
🧠 Cross-Asset Correlations Snapped
In July, dispersion was high: tech soared while energy, staples, and rates decoupled.
In August, everything is moving together - stocks, bonds, gold, and crypto all down simultaneously on bad days.
This is classic “correlation 1” behavior, usually triggered by macro stress or liquidity withdrawal.
📉 Realized Volatility Jumped Sharply
10-day SPX realized volatility surged from 7% to over 14% - a doubling in less than two weeks.
Nasdaq volatility is leading, with semis and software showing violent reversals post-earnings (e.g., NVDA, NOW).
📊 Tail Risk Metrics Are Rebuilding
Skew steepened sharply: OTM puts are getting bid.
VVIX (the volatility of VIX) is climbing - indicating traders are hedging volatility itself.
Gamma exposure flipped negative in early August, removing dealer support.
🥔 Our Take:
The volatility regime has turned. This is not a spike to sell - it’s a structural rotation. With flows thinning and earnings dispersion rising, this volatility is sticky, not transient.
Expect wider ranges, failed breakouts, and whipsaw moves. Hedging has returned. So has opportunity.
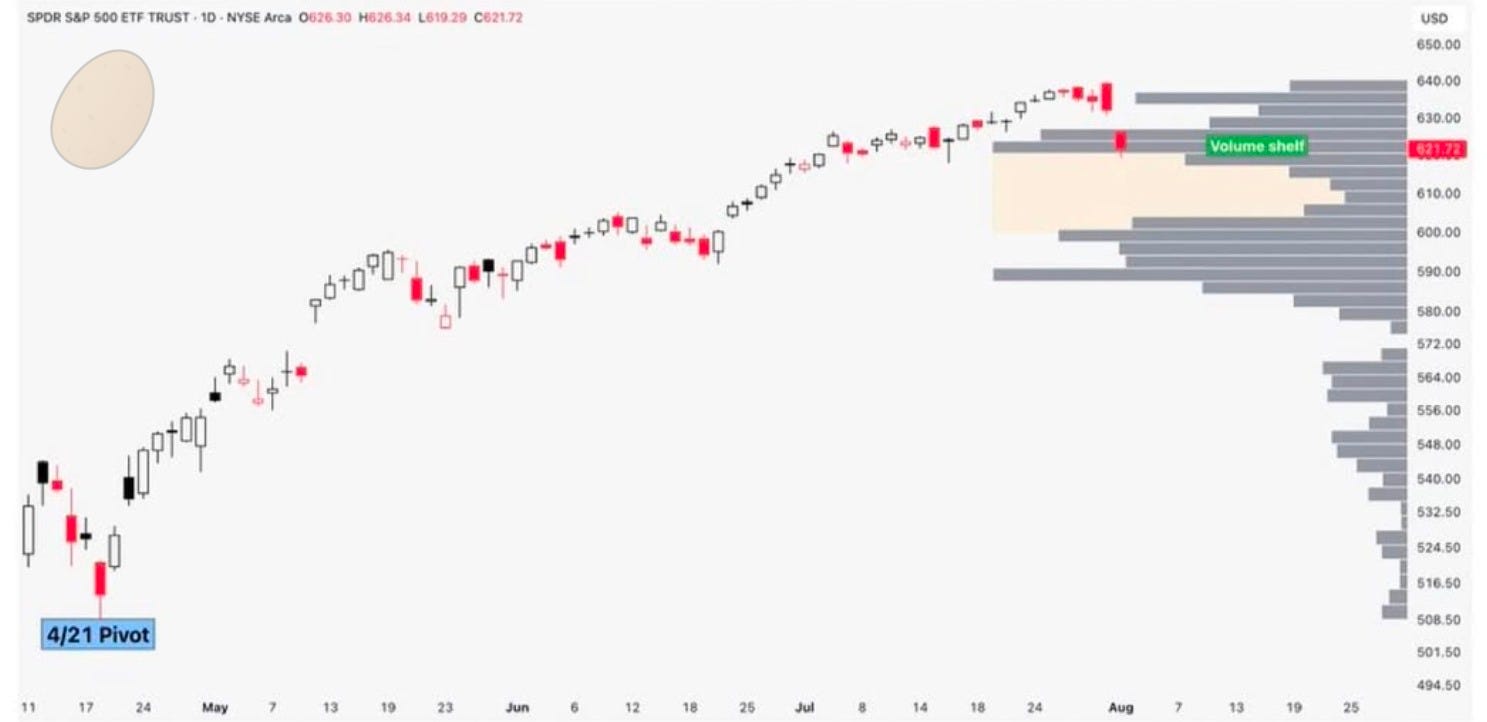
The SPY volume profile also shows an air pocket below 620 - a thin liquidity zone where downside could accelerate:
🧮 Macro Meets Math
If July was an emotional overshoot, August is where quantitative reality reasserts itself. Seasonality, model overlays, and probability-weighted stress signals all say the same thing:
Caution is no longer optional.
📅 August: Second-Worst Month for Equities
Over the last 50 years, August averages -0.2% for the S&P 500.
Median drawdown in August is -3.4%, with volatility clustering around mid-month.
Q3 of the first year in a new presidential cycle tends to see elevated volatility - and 2025 is already tracking that tendency.
August has produced negative returns in 9 of the last 15 years - even in bull markets.
📊 Quant Flags: Stress Indicators Triggered
CBOE SKU Index is spiking - signaling asymmetric demand for tail hedges.
CTA models are trimming long exposure in tech and discretionary after trend signals broke.
Breadth thrusts are fading - fewer than 40% of S&P stocks are above their 20DMA as of August 2.
🧮 Probabilistic Setup: Forward-Looking Risk
Let’s quantify the odds using a regime-matching model based on:
Real yield trends
Liquidity slope
Dispersion behavior
Earnings volatility
Historical analogues (1998, 2007, 2015, 2022) suggest:
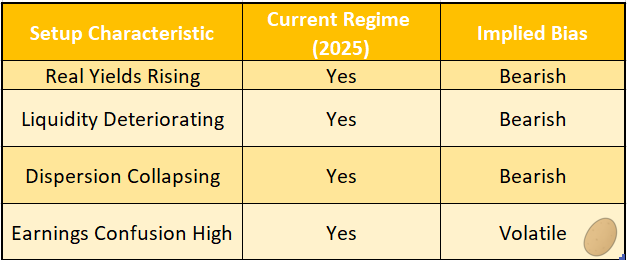
The only time this model flashed 4/4 bearish was August 2015 - which ended in a -10% flush.
🥔 Our Take:
This is where math disarms optimism. We’re not predicting a crash - but the risk/reward profile has flipped, and the statistical edge is now in favor of defense, not greed.
📉 Positioning Reset
Positioning reached euphoric levels in July. But early August has flushed the excess, exposing just how offside the crowd had become.
🧠 Hedge Funds: From Max Long to Tactical Sellers
CFTC data showed asset managers held near 3-year highs in S&P futures net length going into August, with Nasdaq positioning even more extreme.
Structural bullishness masked what came next: the largest hedge fund equity selling in over a year occurred in the final week of July.
Prime broker data and Market Radar flows confirm a sharp de-risking response to volatility and earnings pain.
Put-call ratios remained complacent into the move.
The message? Positioning was stretched. But the unwind has now begun.
📉 Tactical Selling Has Now Begun
While structural positioning was elevated heading into August - especially in index futures - recent flow data (e.g. Market Radar, prime brokers) shows hedge funds are now de-risking tactically.
The largest weekly selling in cash equities since early 2023 occurred in the final days of July, likely in response to macro volatility and positioning pain in crowded longs.
This divergence - long-term exposure still elevated, but short-term flows turning defensive - signals a fragile turning point.
🏦 Passive Inflows Peaked - Then Paused
ETF flows in July totaled $62B - the 4th highest monthly inflow on record.
August has seen a sharp slowdown in flows across tech, consumer, and cyclicals.
ARK-style retail ETF volume has dropped >30% WoW - a signal of fading retail momentum.
💼 Options Dealers: Gamma Flip
On August 1st, SPX dealer gamma flipped negative for the first time since April.
That means dealers are now selling into down moves, not stabilizing them - removing a critical layer of “synthetic liquidity.”
Negative gamma amplifies volatility: instead of leaning against price swings, dealers hedge in the same direction - creating reflexive selling on declines and buying on rallies.
It’s a feedback loop - and in August’s thin liquidity regime, that loop is louder.
📊 Systematic Strategies Are Selling
Trend and volatility-targeting CTAs are reducing long equity exposure as realized volatility jumps.
Risk parity portfolios are de-risking as both stocks and bonds fall - a rare but dangerous correlation regime.
🥔 Our Take:
This was a classic positioning squeeze - slow to build, fast to unwind. The pain is less about magnitude and more about surprise.
Risk wasn’t hedged. Upside was priced. Now, the market is naked in a cold wind.
💼 Earnings Season Dislocations
Q2 earnings season has exposed the fracture lines under the surface of the rally. Strong results aren’t being rewarded, and misses are getting punished - especially in crowded longs.
The problem isn’t earnings. The problem is expectations were priced to perfection.
📉 Post-Earnings Reaction Trends
Negative price reactions dominate - even companies beating on revenue and EPS (e.g., MSFT, GOOGL) saw muted or negative follow-through.
Dispersion is widening - sector-neutral baskets are diverging by over 15% from peak to trough in the past 10 trading days.
🏗️ Sector-by-Sector Breakdown

💥 Landmines Were Everywhere
NOW -16% post-earnings despite strong fundamentals - a poster child for over-positioned quality getting sold.
AAPL’s hardware miss triggered ~$120B in market cap loss in one session.
Small caps and high beta names are seeing -20% to -30% moves on even modest guidance cuts.
🥔 Our Take:
This is a seller’s tape, not a buyer’s tape. Earnings season is doing what macro couldn’t - exposing fragility through price action.
Expect more earnings drift, guidance slashes, and “good news sold” reactions through mid-August.
🗳️ Inflation & Political Risk Watch
Markets want inflation to behave. Politicians want it to vanish. But the data… tells a more stubborn story.
🧾 CPI Is Mutating - Not Melting
Headline inflation continues to ease - but core CPI remains sticky, particularly in:
Services: transportation, shelter, medical care
Insurance: health + auto
Food at home: sticky input costs + geopolitical risks
Even the Fed’s supercore metric (ex-housing services) is re-accelerating.
Inflation is no longer just about energy and supply chains. It’s structural, slow-moving, and politically radioactive.
📉 Market Repricing: September Cut Odds Surged
July 31: Market-implied odds of a September rate cut were ~30%.
August 2: After a soft jobs report, those odds jumped to ~82%.
2Y yields dropped, and rate-sensitive sectors (REITs, tech) rebounded modestly.
The bond market is now rebuilding expectations for two cuts in 2025 - up from just one priced in mid-July.
🏛️ Political Optics: Inflation as a Wedge Issue
As the 2024 cycle echoes into 2025, inflation has become a policy battleground:
Tariff talk (China, EVs, steel)
Drug pricing legislation
Food and housing affordability mandates
This creates “optical disinflation” pressure - politicians want inflation to look fixed, even if the underlying pressures persist. The result? Distorted data, distorted incentives.
🥔 Our Take:
The Fed is back in play. But markets are pricing a pivot - not a plan.
The inflation fight is entering a messy, politicized endgame. Rate expectations will stay volatile - but the Fed is cornered:
Too early to cut, and it risks its credibility.
Too late to cut, and the economy slows into the election window.
This isn’t over. It’s metastasizing - into wages, policy, and market psychology.
📊 Charts, Tables & Models
Below are the core macro visuals that define the August setup - from inflation stickiness to volatility triggers and positioning pain.
🧾 CPI Trend Breakdown (YoY %)
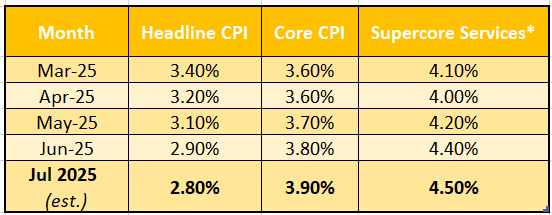
Core CPI is drifting up, not down - masking the inflation resurgence beneath the soft headline narrative.
📉 Fed Rate Cut Repricing: September Odds
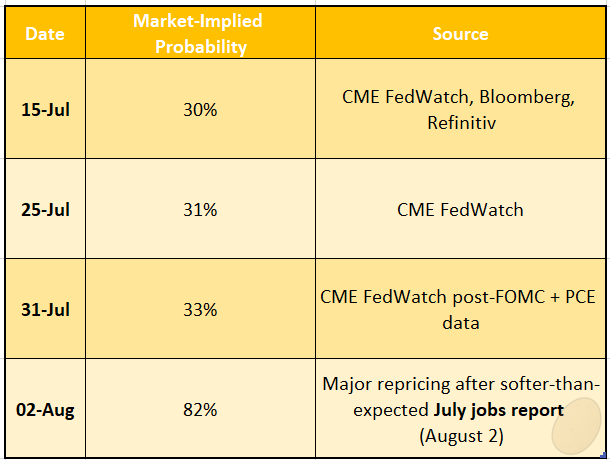
A surge in cut probability, not a collapse, triggered the August volatility spike and cross-asset repricing.
⚠️ VIX Term Structure Snapshot (as of Aug 2)
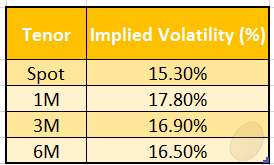
Inverted Structure: The curve is no longer upward-sloping (contango) - 1M > 3M > 6M, which is atypical.
Historical Precedents: Seen during:
March 2023 regional banking stress
August 2022 inflation panic
Interpretation: This indicates front-loaded hedging demand and short-term fear, typically triggered by:
Macro uncertainty (e.g., Fed policy shifts, inflation reacceleration)
Volatility regime transition
Liquidity deterioration
💰 Equity ETF Flow Trends (July → August)
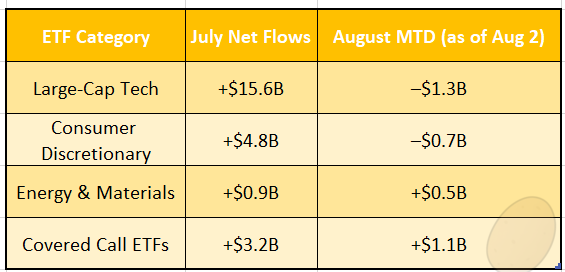
Momentum Fade: The reversal in tech and consumer flows highlights a rotation away from crowded growth bets.
Defensive Rotation: Positive inflows to Energy/Materials and Covered Call ETFs reflect a defensive income tilt, in line with rising volatility and weakening breadth.
Supports Thesis: These flow trends corroborate the liquidity, volatility, and positioning regime shifts discussed earlier in the post.
🥔 Our Take:
Inflation is stickier than the headlines suggest
Policy odds are repricing violently after the jobs data
Volatility structure has decisively flipped
Flows are rotating from momentum to defense
This is no longer a liquidity-fueled melt-up. It’s a math-driven reversion phase - and the market is now reacting accordingly.
🥔 Final Take: The August Setup
August isn’t just seasonally weak - it’s structurally fragile. For the first time since the Q4 2022 Fed pivot, all key macro forces are aligned bearishly:
Liquidity: Net liquidity is deteriorating - the TGA is refilling, RRP drainage has stalled, and QT rolls on with no offset.
Volatility: The regime has turned. This is sticky structural vol, not a transient spike.
Positioning: Overcrowded longs are unwinding - tech, discretionary, and beta are all bleeding out.
Inflation: Core pressures are quietly backsliding higher, and the Fed is politically cornered.
Rate Expectations: In a single week, the market erased three full rate cuts - a violent repricing of hope.
This is not a crash call. But it is a clear asymmetric setup: the upside is capped, while the downside is finally repricing in real time.
🍟 Potato Capital Positioning Bias - August 2025
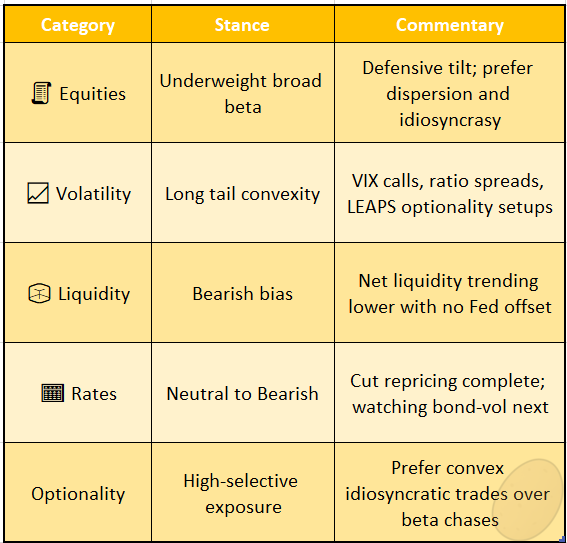
If you’ve been waiting for the market to crack - it’s cracking. Slowly. Quietly. Structurally.
The edge isn’t in panic. It’s in preparation - especially when the crowd is still positioned for yesterday’s regime.
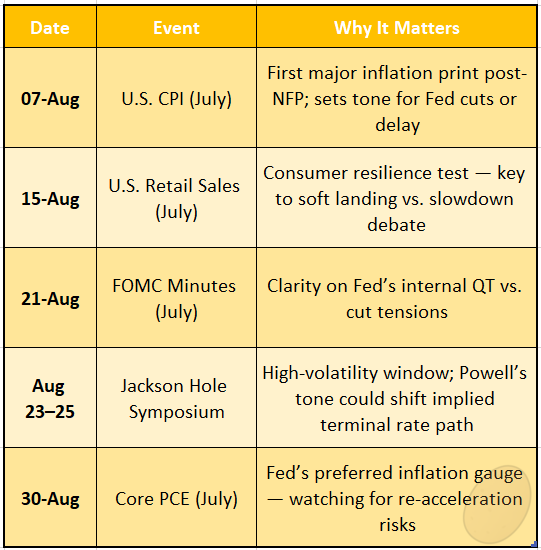
📅 Calendar: Events & Earnings to Watch
August may be volatile - but it’s also event-rich, with macro catalysts and second-half earnings stragglers that could reshape positioning into September.
🗓️ Key Macro Events
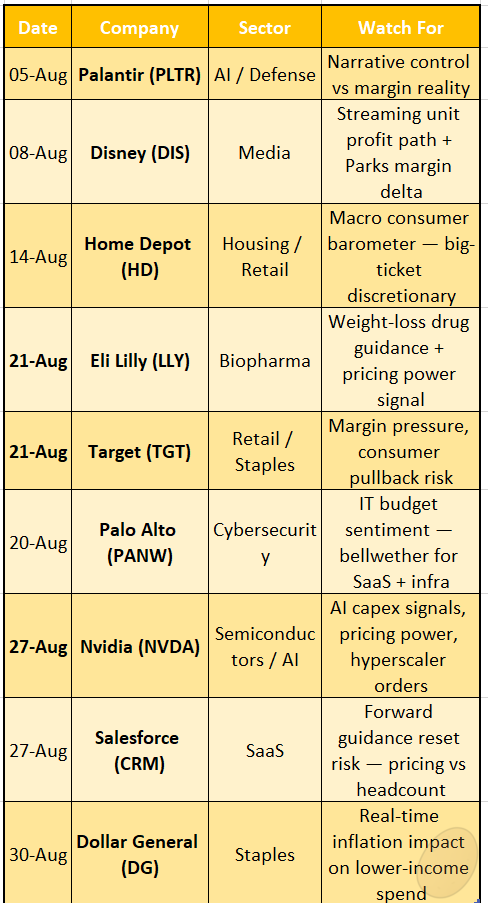
💼 Late-Cycle Earnings to Watch
📚 Posts You May Have Missed
Here’s what we published recently that still frames the current regime:


🎯 August is about discipline. Not panic. Not hope.
We’re not predicting collapse - we’re respecting probabilities.