

💥 September’s Tightrope: Liquidity Fragility, Sticky Inflation, and the Fed’s Dilemma - Potato Capital Monthly Newsletter September 2025
Why liquidity stress is flashing yellow, global risks are compounding, and the Fed’s path is narrowing
🔑 Executive Summary
September represents a collision of three forces: stretched valuations, bumpy disinflation, and fiscal dominance. Each alone is manageable; together, they create a regime where convexity is mispriced and fragility underappreciated.
Equities entered September at record highs, but the rally is brittle. The S&P 500 price-to-book ratio at 5.3 now exceeds the dot-com peak. Forward P/E >22× compares to a post-2008 average of 16×; at these levels, 12-month forward returns have historically averaged just 2-4% versus 8% long-run. Leadership remains concentrated: the Mag-7 are ~34% of S&P 500 market cap, and Nvidia alone contributed ~20% of YTD index gains. In 2000, 2007, and 2021, similar breadth collapses preceded major drawdowns.
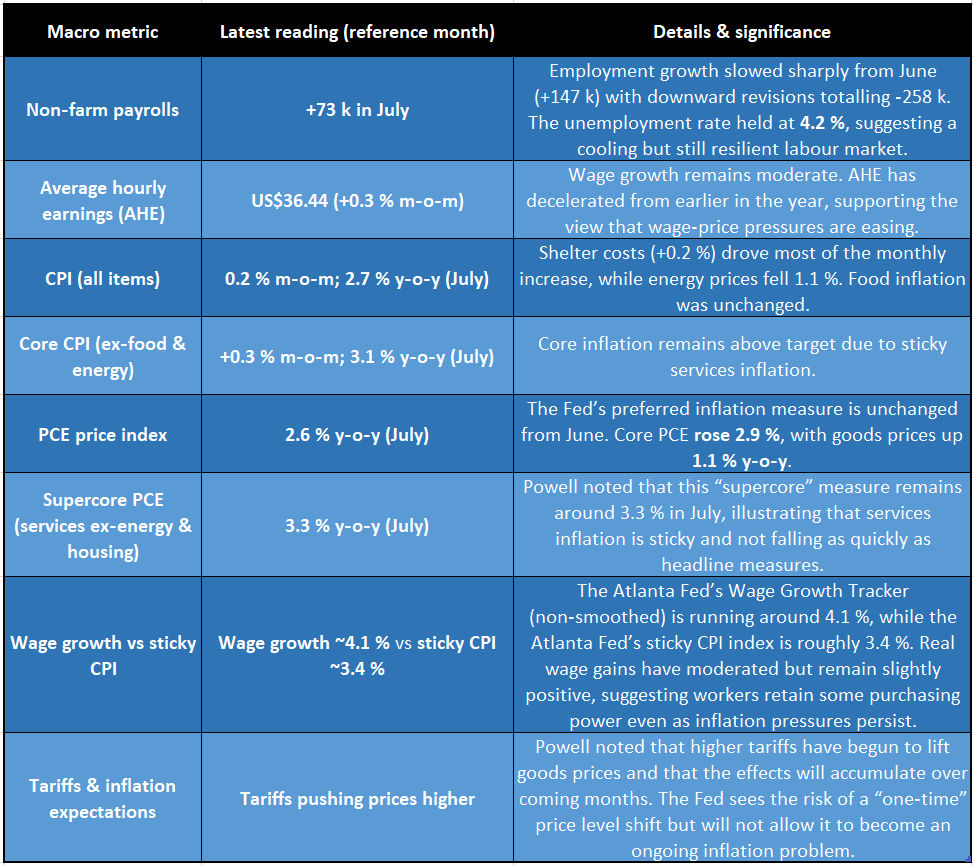
Inflation’s stability masks its stickiness. Headline CPI/PCE ~2.6-2.7%, but core services remain >3%, and tariffs are adding cost-push pressure. Powell acknowledged at Jackson Hole that these effects are likely to intensify. Goods disinflation is done; what remains are slow-moving structural drivers: services inertia, reshoring, and fiscal impulse.
The labor market shows fatigue. July NFP rose +73k, unemployment held 4.2%, prior months revised -258k. Unit labor costs rose 1.6% (q/q annualized) in Q2 and ~2.6% y/y, while average hourly pay is still running near ~4%, keeping pressure on margins as productivity gains lag. The last time wage growth exceeded productivity for multiple quarters (2015–16), S&P EPS growth flatlined despite topline stability.
Taken together, September’s setup is not collapse, but fragility without redundancy. Markets are priced for a smooth pivot. History suggests pivots against sticky inflation and fiscal dominance are messy. Convexity is underpriced and that is the opportunity.

🌊 Liquidity & Market Conditions
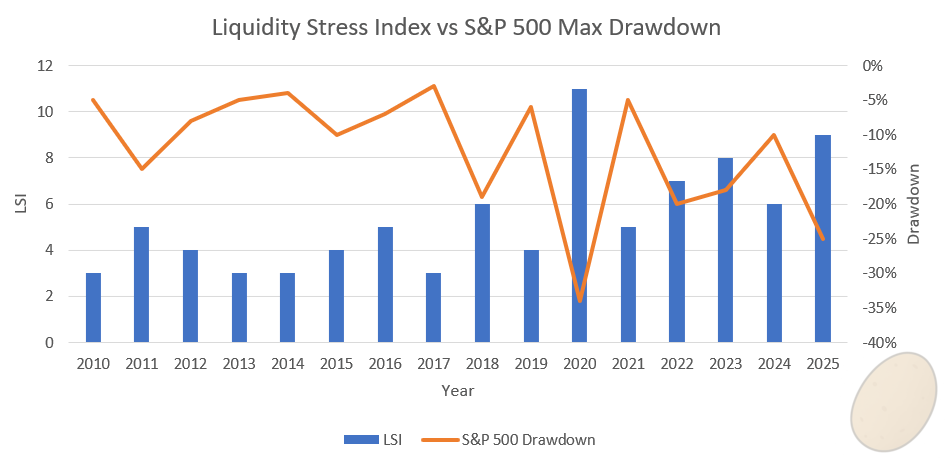
Our Liquidity Stress Indicator (LSI) climbed from 1.5 to 2 since early summer. Yellow, not red, but historically decisive. Whenever LSI crossed 2 (2011 debt ceiling, 2015 China devaluation, Q4-2018 QT, Mar-2020 pre-Fed intervention) volatility spiked within two months and equities suffered double-digit drawdowns.
This time:
Reserves thinning under $95B/month QT plus heavy Treasury issuance.
Cross-currency basis spreads (EUR, JPY) widening - global funding costs rising.
S&P futures depth has thinned materially versus pre-pandemic norms, heightening flow sensitivity.
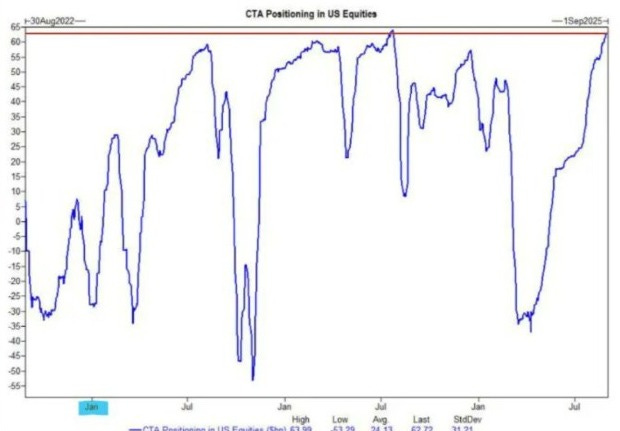
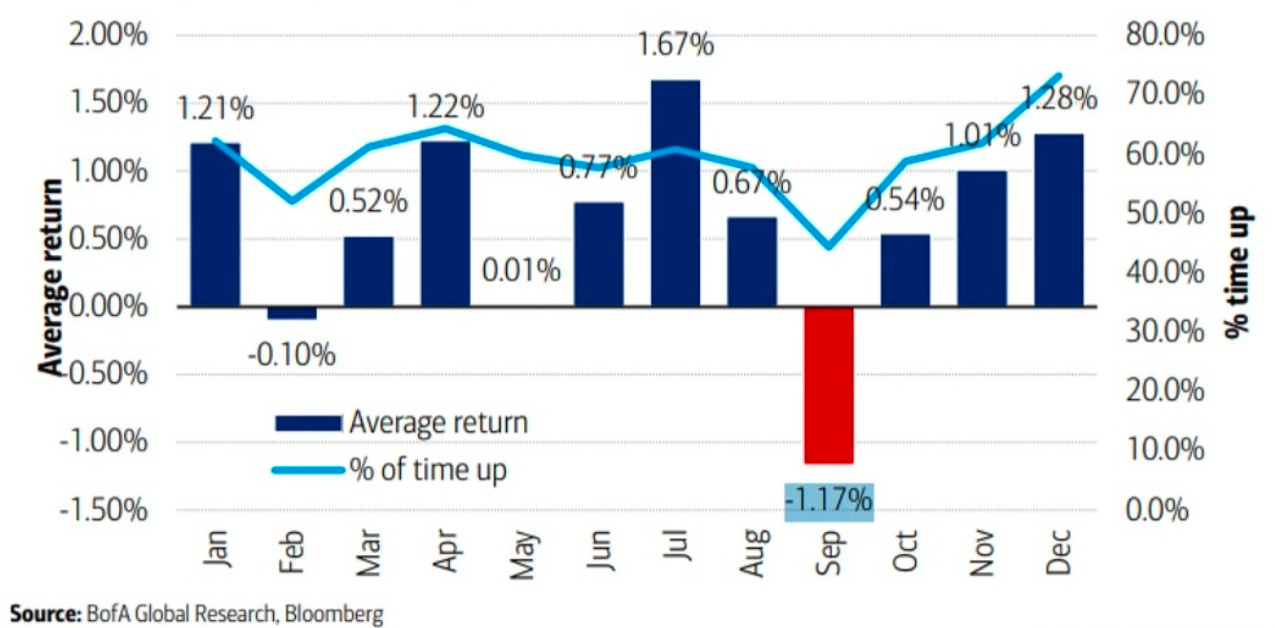
Trend-following CTAs are near max net-long exposure by several sell-side models, leaving little incremental flow support into what is seasonally the weakest equity month.
🥔 Our Take: Oxygen is thinning. Fragility means small shocks propagate with outsized impact. Use the calm to buy convexity: SPX 1-mo 95-90% put spreads cost ~50bps (20th percentile since 2010). Payer swaptions hedge fiscal term-premium risk. Equity-credit correlation shorts monetize dispersion.
🌀 Volatility & Correlation Regime
Volatility is migrating. The VIX sits near 13, yet Nvidia sold off post-beat, Dell -9% on guidance, Hormel -13% on costs. Correlations are breaking: gold rose with equities, bonds failed to hedge equity sell-offs.
The divergence is quantifiable: VIX ~13 vs realized volatility ~15 - a negative implied/realized spread in the 10th percentile of the past decade. In 2017 and 2021, similar gaps closed violently as implied volatility repriced upward.
Market structure adds fragility:
Dealer gamma is thin; skew flattened by retail call-buying.
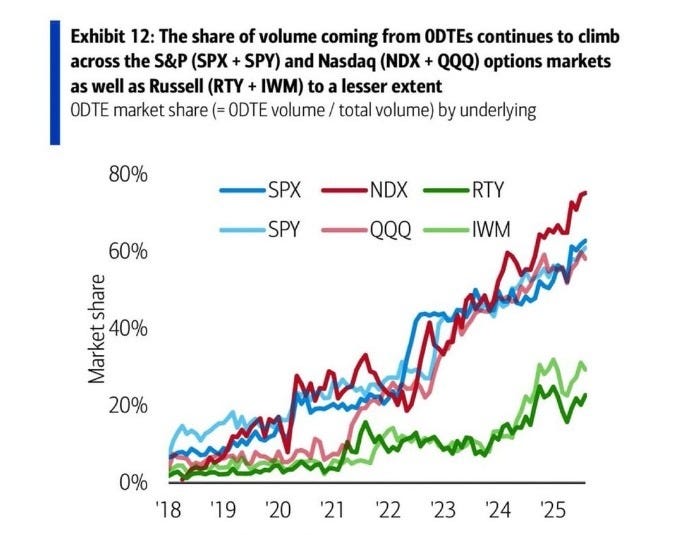
0DTE options now ~80% of Nasdaq options volume, magnifying intraday moves.
Macro vols (rates, FX) trade at multi-year lows, suppressing hedge costs despite policy uncertainty.
🥔 Our Take: This is not a “sell the spike” volatility regime, instead buy convexity before the spike environment. Long gamma in indices, payer swaptions on 2-5y rates, and cross-asset correlation trades offer convex payoff. September CPI + FOMC are the catalyst window.

🧮 Macro Meets Math
Payrolls +73k, Unemployment Rate 4.2%, revisions -258k. Wages ~4.1% still exceed productivity (+1.1%). Unit labor costs rose 1.6% q/q annualized (~2.6% y/y), continuing to squeeze margins. Consensus still embeds 12% EPS growth in 2025 - historically, when unit labor costs exceeded productivity, EPS growth averaged just 3–4%.
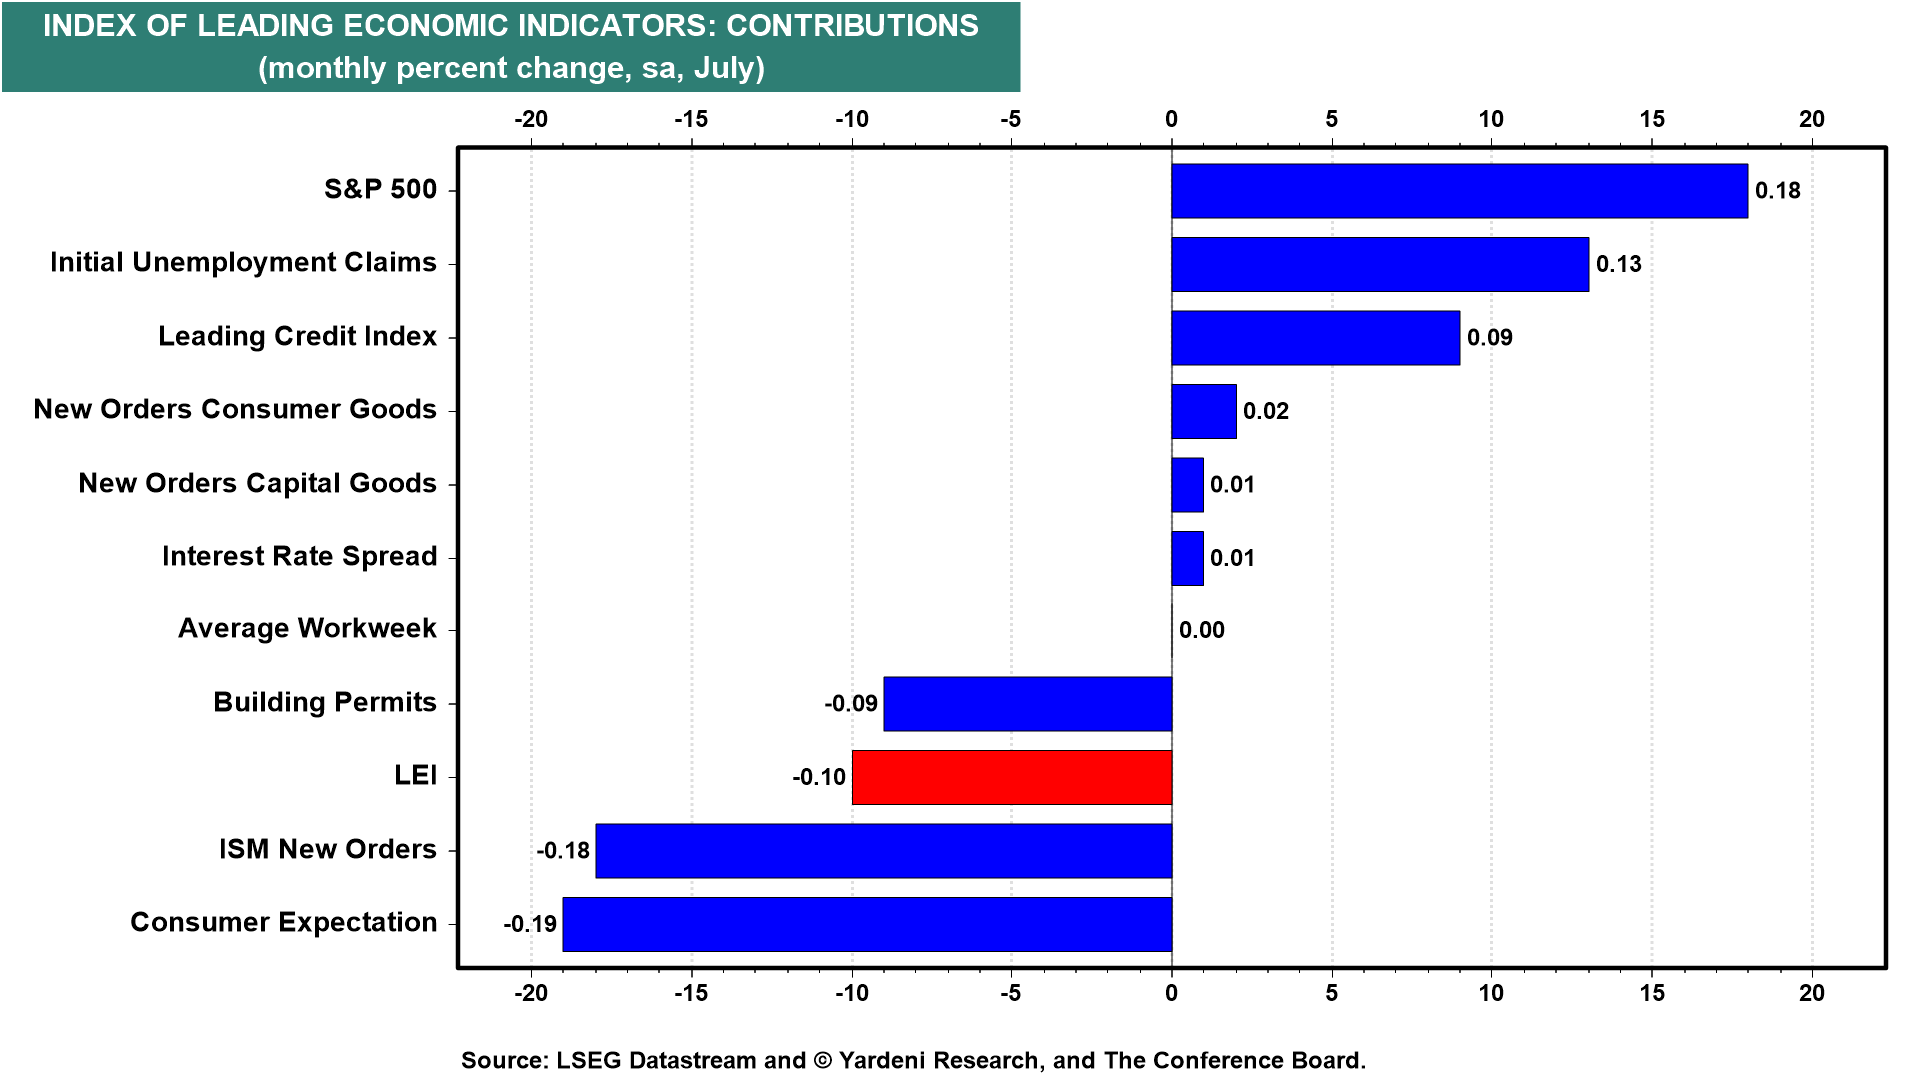
Inflation is sideways but sticky. CPI 2.7%, core 3.1%; PCE 2.6%, core 2.9%; supercore ~3.3%. Goods disinflation is done; services inertia dominates. Tariffs now add incremental upside. Powell referred to it as a “price-level shift,” but there’s a risk of expectations becoming embedded.
Divergence in expectations plays a critical role. Market breakevens are around 2.5%, while consumer surveys indicate approximately 3.5%. In previous cycles, such as the 1970s and early 2000s, this mismatch necessitated either additional monetary tightening or elevated inflation premia.
🥔 Our Take: The macro environment is eating into margins without being outright recessionary. Costs remain stubborn as revenue growth slows, creating a tough backdrop for equities. Focus on dispersion: strong balance sheets will outperform, while high-expectation growth stocks are likely to fall behind.
💼 Earnings, Positioning & Sentiment
Earnings confirmed the wedge between priced-for-perfection and credible growth. Nvidia beat, yet sold off. Dell collapsed despite AI sales. By contrast, Snowflake, MongoDB, and Datadog surged 20-38% off depressed multiples.
The Mag-7 now trade at PEG ~2.5× vs 1.5× historical. Russell-2000 forecasts bake in double-digit growth that looks unrealistic. High Yield OAS sits ~280-300bps, near post-2010 tights; another sign of credit complacency.
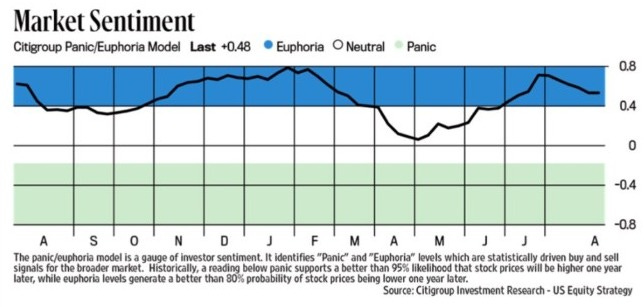
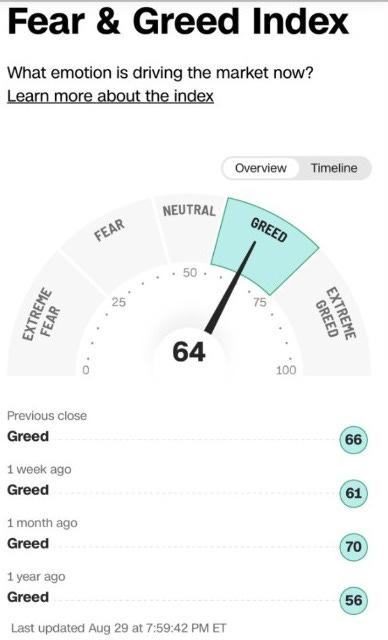
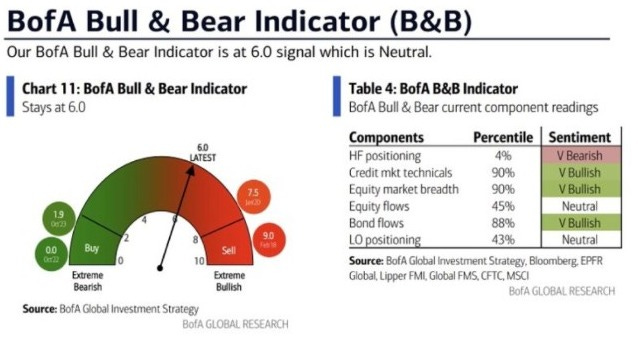
Composite sentiment gauges (Citi Panic/Euphoria, Fear & Greed, BofA Bull & Bear) skew toward optimism/greed, consistent with tight spreads and low index volatility.
🥔 Our Take: Dispersion is widening. High-expectation AI bellwethers are fragile; reset multiples in quality software and cyclicals attractive. Trim crowded longs, rotate toward durable FCF, and layer dispersion trades.
🏛 Policy & Political Risk
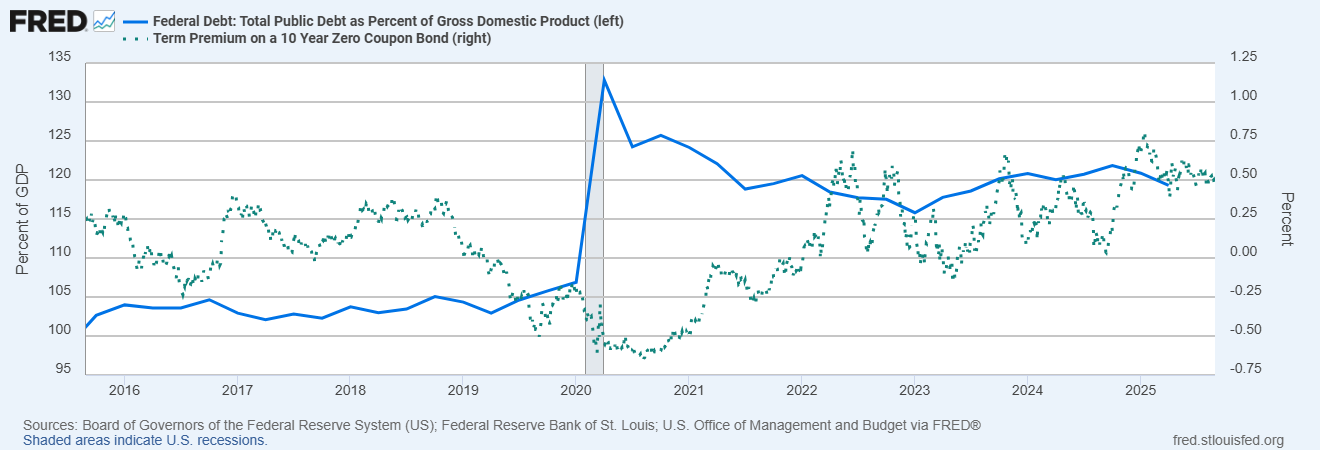
Policy is a two-front war: inflation inertia and fiscal dominance. Core CPI/PCE sticky; tariffs inflationary. July’s tax bill adds >$3T to deficits, pushing deficit/GDP >6-7%. Net interest costs projected to exceed defense spending by 2026.
The Fed is trapped. Powell balanced upside inflation vs downside jobs risk - classic policy-error terrain. Futures now assign ~70-90% odds of a September cut and ~65-100 bps of easing over the next year. The attempted dismissal of Governor Lisa Cook, now under legal challenge, adds a governance-risk premium.
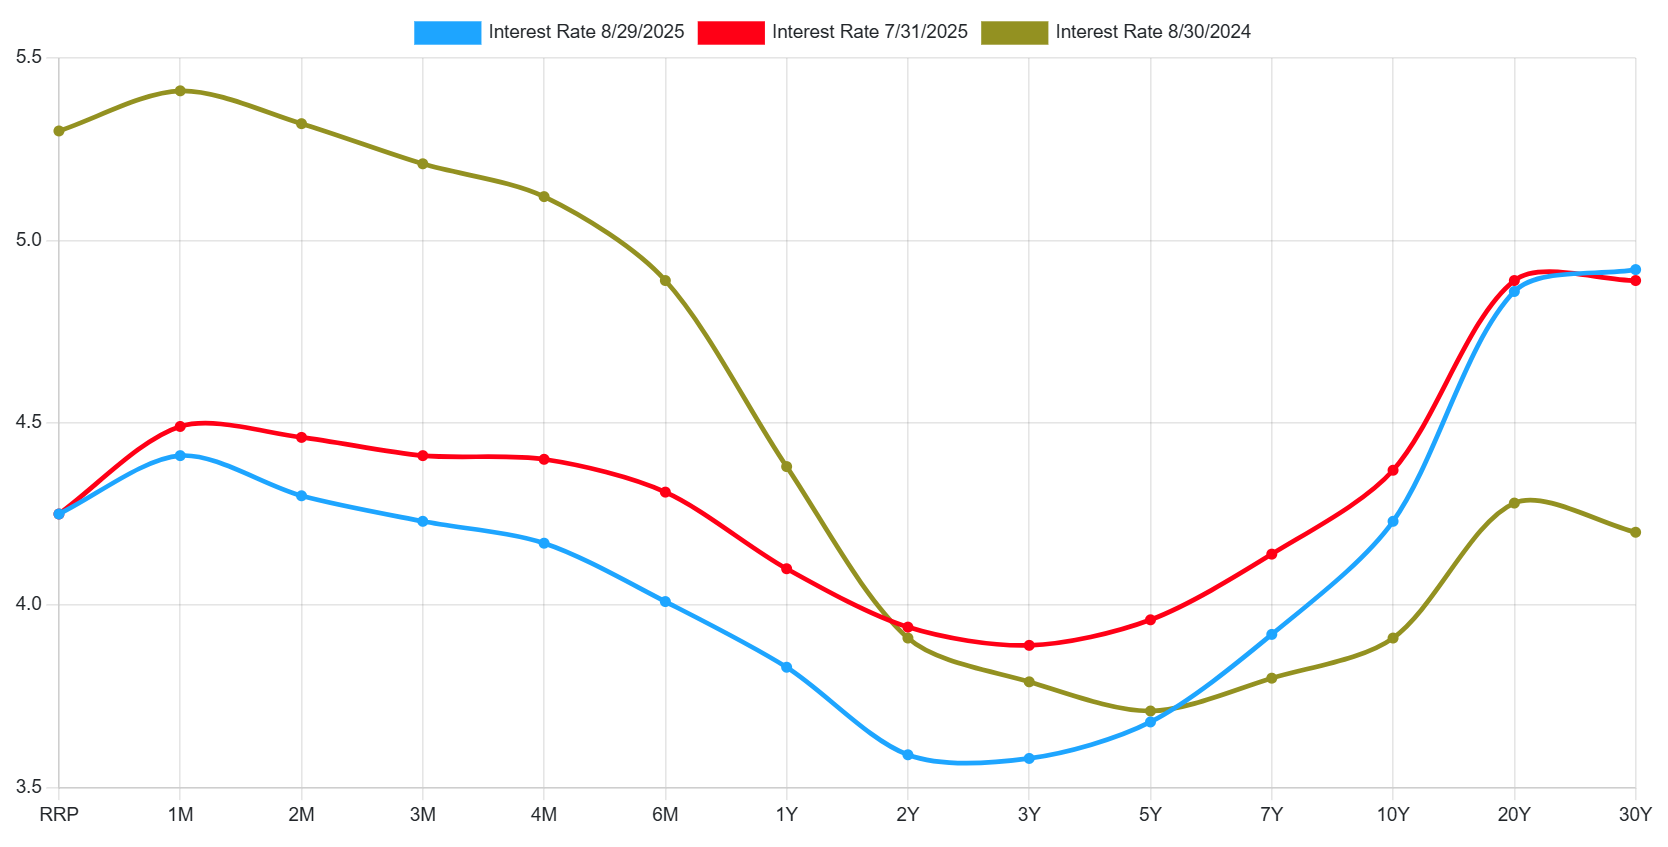
Curve confirms it: the 30y-2y spread is steepening to widest since 2021. Unlike 2019 QE-light, this steepening is fiscal-driven, not growth-driven.
🥔 Our Take: Even with cuts, the long end may not rally. More 1940s repression/1970s deficit inflation than 2019 easing. Position for term premium persistence, don’t chase duration without hedges.
🌍 Global Macro & Geopolitics
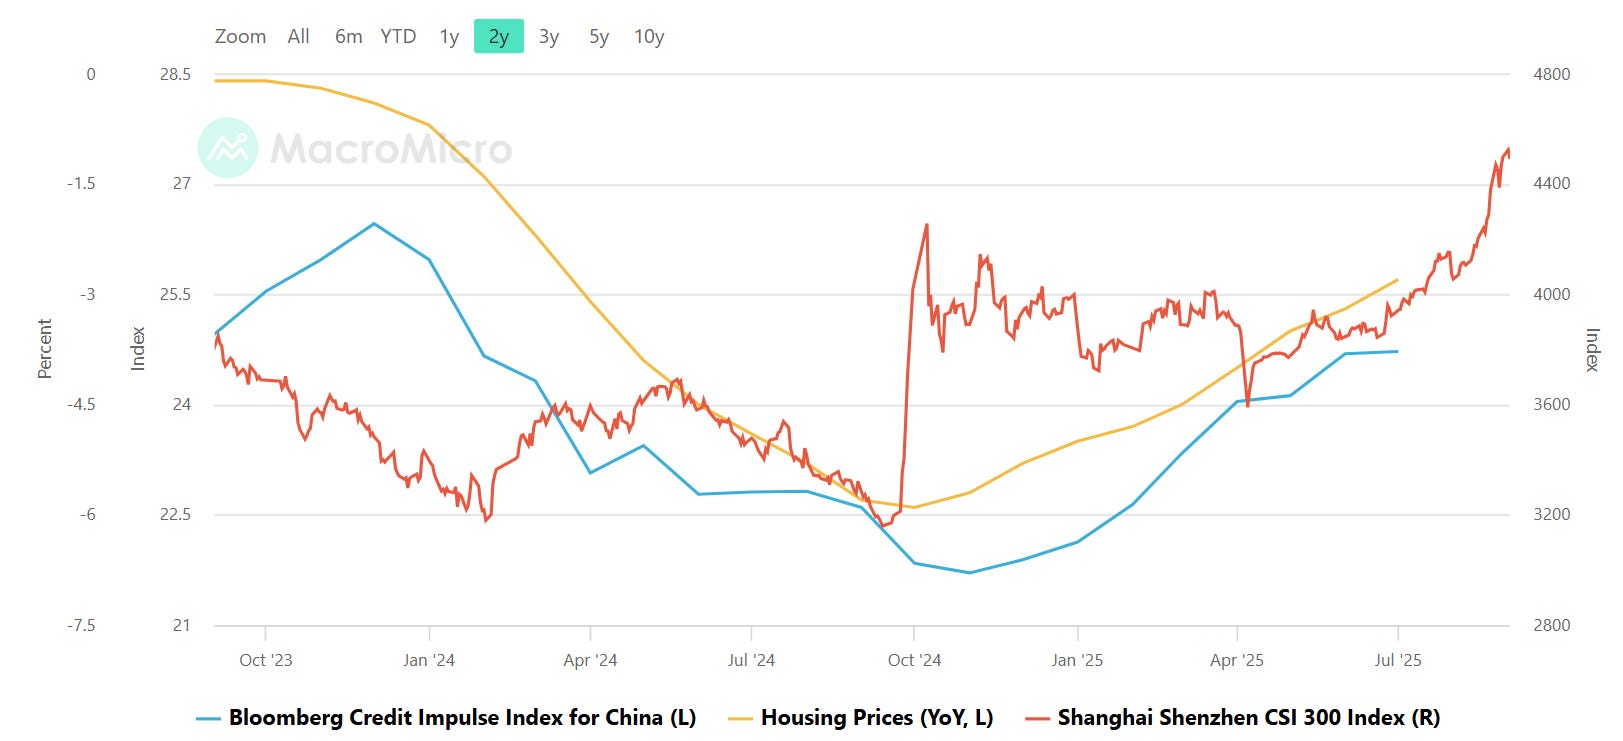
China’s property slump persists: investment -12% y/y (Jan-Jul) and sales by floor area -4% y/y. TSF (Total Social Financing) credit impulse remains negative. German exports are soft, Europe PMIs are contracting, and Japan is slowing. Middle East tensions keep oil volatility elevated: the OVX has been printing ~32-34 into early September. South China Sea risks linger.
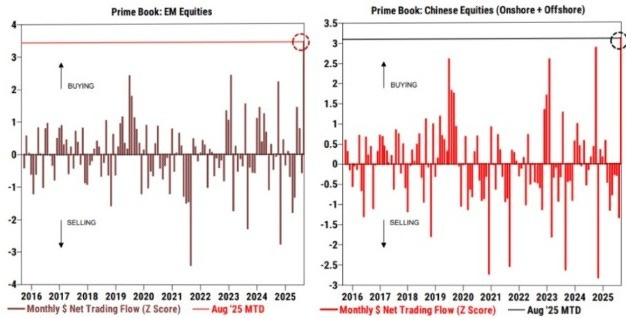
Flows confirm: hedge funds poured record inflows into EM and China equities in August (Goldman Prime). If USD liquidity tightens, these flows are vulnerable to sharp reversals.
🥔 Our Take: These are key regime drivers: prioritize liquidity beneficiaries like gold, T-bills, and defensives. Be cautious in emerging market credit and hedge against FX mismatches. Keep energy optionality open, as geopolitical convexity offers inexpensive protection relative to the risks.

📊 Valuation Framework
Scenario IRR Table (12M horizon, S&P 500)
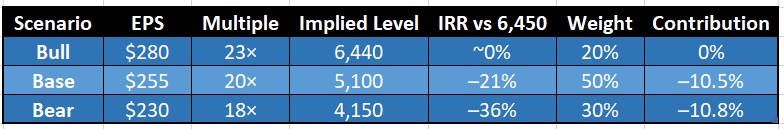
Scenario-Weighted IRR ≈ -21% over 12 months.
Spot levels already price the bull case. Rate cuts may sustain multiples, but they are fragility cuts (2000/2007) rather than insurance cuts (1995/2019). With EPS risk still tilted down from sticky core inflation and unit-labor-cost pressure, forward returns skew flat-to-negative at the index level.
Valuation Sensitivity Matrix

Only the best-case (bull EPS + peak multiples) justifies current levels.
🔎 Historical Fed Cut Regimes & Forward Returns
1995 Insurance Cuts (disinflation): +30% forward return
2019 Insurance Cuts (sub-2% inflation): +15%
2000 Fragility Cuts (bubble valuations, sticky costs): -9%
2007 Fragility Cuts (housing rollover, fiscal stress): -37%
When cuts occur at stretched valuations with sticky inflation/fiscal dominance, forward returns skew negative. 2025 maps closer to the fragility cut regimes.
Path vs Endpoint
It’s possible for 2026 to be a strong year even if 2025 disappoints. Here’s why:
NTM fragility: High valuations, sticky services inflation, and fiscal dominance cap multiples and compress EPS, leaving the distribution skewed negative in the near term.
2026 endpoint potential: If wage/productivity gaps close, supply chains normalize, and fiscal policy stabilizes, EPS could recover into the $270-280 range with 20× multiples. That supports an S&P ~5,400-5,600 - a healthier base for a new bull cycle.
🥔 Our View: We are index-skeptical for the next 12 months but not long-term bearish. The real opportunity is in:
Convexity trades (volatility, dispersion, correlation)
Balance-sheet quality with reset multiples
Real assets and defensives as insurance
Tactical re-entry points when the distribution clears
The S&P is priced for perfection. Our weighted IRR of -21% highlights poor near-term index risk/reward. But that does not preclude 2026 being an up year if the system clears today’s fragility. We don’t want to short everything, but we don’t want to pay peak multiples for a market already at its bull-case fair value.
📦 Flow Monitor
CTAs: near max-long positioning by several sell-side models.
Volatility-target funds: Max leverage; vulnerable to volatility spikes.
Dealer gamma: Thin. 0DTE ~80% of Nasdaq options.
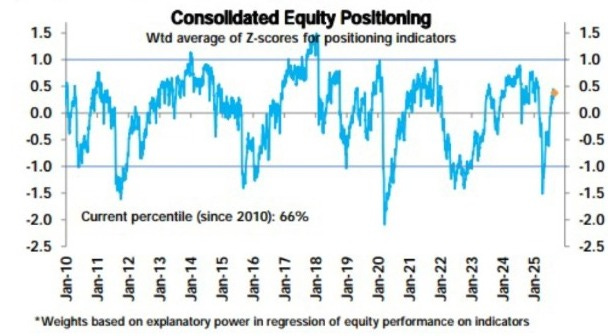
HF positioning: Divergent - EM/China inflows vs domestic caution.
LO positioning: Neutral.
No marginal buyers left at the index level. Market microstructure is flow-driven and fragile.
🥔 Final Take
August’s goldilocks backdrop hid fragility: thin breadth, sticky core inflation, labor fatigue, fiscal dominance, maxed-out positioning, and amber liquidity stress. September’s CPI and FOMC are not just binary events - they define the path the market must travel.
This is fragility without redundancy. The index is already priced for the bull case; forward IRRs are flat-to-negative unless both earnings and multiples hold at extremes. That makes convexity the cheapest insurance you’ll buy.
Action Plan:
Trim crowded winners (Mag-7, AI bellwethers) where perfection is priced in.
Upgrade to balance-sheet quality with durable FCF and reset expectations.
Diversify exposures with real assets (gold, TIPS, infrastructure).
Layer hedges: index put spreads, payer swaptions, dispersion longs.
Edge = Discipline × Convexity × Patience. The next 12 months are about surviving fragility to reach a better entry point in 2026. September is where positioning collides with policy; where those prepared to monetize convexity will outperform.


